
- Quick Comparison
- Why Contractors Need Revenue Forecast Reports
- 1. Work In Progress (WIP) Report
- 2. Billing by Job and Forecasted Billings Report
- 3. Aged Accounts Receivable (AR) Report
- 4. Cash Flow Forecast vs Actual Cash Flow Report
- 5. Earned Revenue and Percent-Complete Report
- 6. Change Order Log and Revenue Impact Report
- 7. Job Cost Margin and Profitability Report
- How These Reports Work Together
- Key Revenue Metrics to Compare Across Reports
- Warning Signs Hidden in Revenue Reports
- Conclusion
- FAQs
Here’s a nightmare scenario.
You check your construction company’s bank account and see $4,964 left.
And you’re only finding out about it now.
That would’ve been fine if you’d already paid your crew, suppliers, equipment bills, and everything else—and you had a nice fat payment coming in tomorrow.
But NOPE. Payroll is coming up. Suppliers are waiting. Another project needs materials.
And now you’re back to figuring out where the heck you’re going to get the money.
Cash flow is one of the most stressful parts of running any business—but especially in construction, where money has to keep moving for the work to keep moving.
The problem is, cash problems don’t usually appear overnight. There are often warning signs sitting in your numbers weeks or even months before your bank account starts looking scary.
That’s why revenue forecast reports matter.
They help you see whether earned revenue, billings, collections, and job costs are actually moving together—so you’re not learning about a cash problem by looking at your bank balance when it’s already too late.
Here are seven reports worth watching:
- WIP shows earned revenue versus billings
- Billing by job shows invoice timing and retainage
- Aged A/R shows which invoices are still unpaid
- Cash flow forecast vs. actual shows what hit the bank
- Earned revenue / percent complete shows revenue based on work performed
- Change order log shows whether scope changes support forecasted revenue
- Job cost margin shows whether revenue is turning into profit
Quick Comparison
| Report | Main Use | What It Flags |
|---|---|---|
| WIP Report | Compares earned revenue to billings | Underbilling, overbilling, margin fade |
| Billing by Job | Tracks invoice status by project | Late invoices, retainage, billing delays |
| Aged A/R | Tracks unpaid invoices by age | Slow collections, dispute risk, 90+ day balances |
| Cash Flow Forecast vs. Actual | Compares expected cash to bank activity | Cash shortfalls, timing gaps, weak forecasts |
| Earned Revenue / Percent Complete | Calculates revenue from job progress | Revenue booked ahead of work or behind schedule |
| Change Order Log | Tracks approved, pending, and disputed changes | Forecast inflation, unpaid extra work |
| Job Cost Margin Report | Tracks gross margin by job | Cost overruns, weak pricing, profit erosion |
One report is never enough. They need to be reviewed together. When those reports drift apart, the warning signs usually show up as underbilling, aging receivables, managing change orders, or falling gross margin.
sbb-itb-5eea312
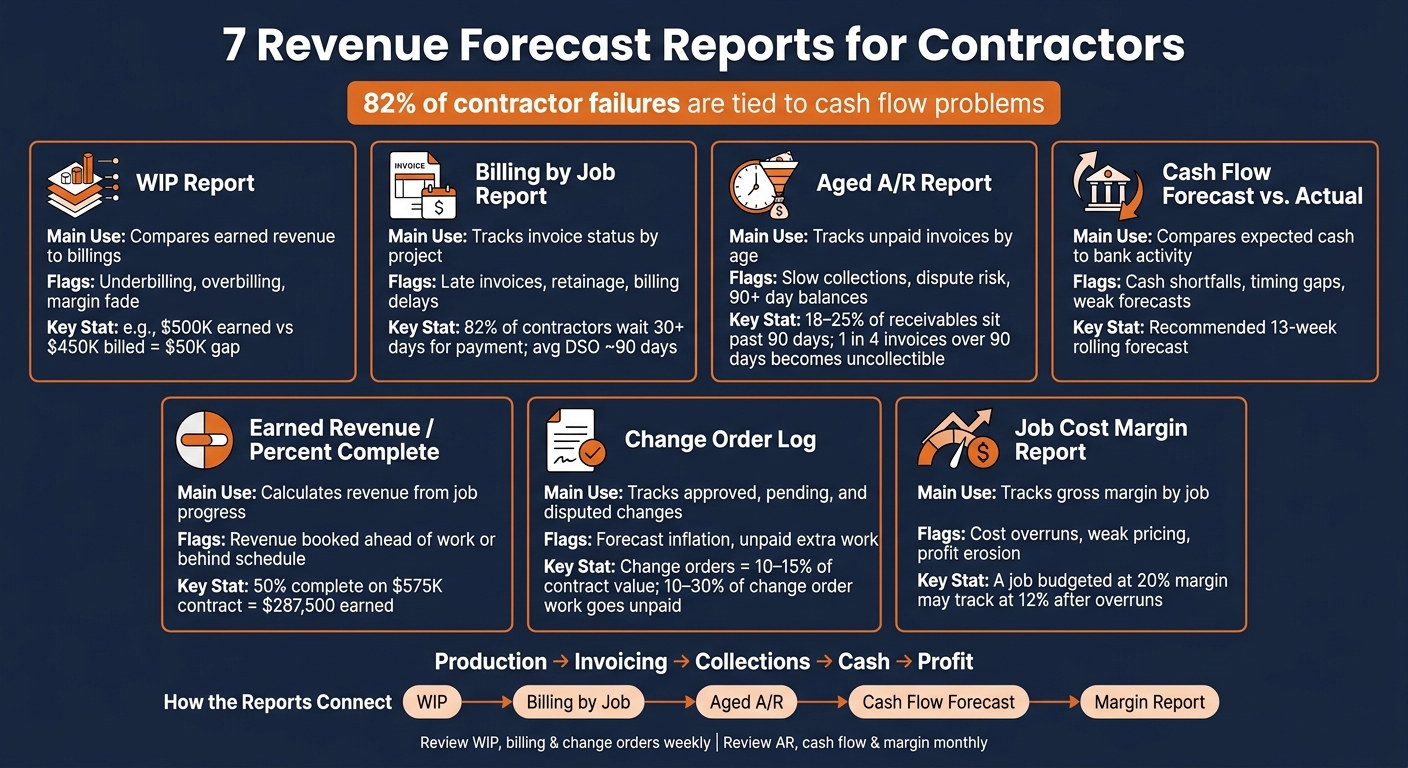
7 Revenue Forecast Reports for Contractors: At-a-Glance Comparison
Why Contractors Need Revenue Forecast Reports
Construction revenue moves on four different timelines: work performed, revenue earned, invoices sent, and cash collected.
Under cost-to-cost accounting, percent complete = costs incurred to date ÷ estimated total cost, and earned revenue = percent complete × contract value. That sounds clean on paper. In practice, billing still lags behind earned revenue, and cash can lag even more.
Progress billing adds another layer: retainage. Contractors bill for finished work, but part of each payment is often held back until substantial completion or final completion. So even when revenue has been earned, that money may not be in the bank yet. When retainage is tracked separately from accounts receivable, standard billing reports can make available cash look better than it is.
That gap matters. Job cost reports track labor, materials, and subcontractor costs against budget, but they do not show the full revenue picture. They do not show whether revenue has been billed, whether invoices are aging past due, or how much retainage is still tied up. A project can stay under budget and still squeeze cash flow if collections slow down.
WIP is the first report to check because it shows whether earned revenue matches job progress.
1. Work In Progress (WIP) Report
The WIP report, also called the contracts-in-progress schedule, gives the clearest job-by-job view of forecasted revenue versus earned revenue. Revenue timing starts with job progress, so WIP is the first check for whether forecasted revenue lines up with actual job performance. It lists each active job and shows the revised contract value, estimated total cost, costs incurred to date, percent complete, earned revenue to date, billings to date, and the overbilling or underbilling position.
Forecast vs. Actual Revenue Visibility
The WIP report ties forecasted revenue to revenue recognized so far. A simple example makes the math clear. On a $1,000,000 job with $800,000 in estimated costs and $400,000 spent to date, the job is 50% complete. That means $500,000 in revenue has been earned. If billings total only $450,000, WIP shows a $50,000 gap between earned revenue and billings. That gap helps tighten near-term revenue forecasts.
It also shows something more practical: whether future billings are likely to keep up with production or fall behind.
Job-Level Billing and AR Tracking
The overbilling and underbilling columns show billing status at a glance. Underbilling means earned revenue is higher than billings, so the contractor is covering job costs before the cash comes in. Overbilling means billings are higher than earned revenue, which can give short-term cash relief but also means work still has to be delivered without the same level of new cash coming in.
The picture gets sharper when WIP is tied to the aged accounts receivable report by job. A job that is $75,000 underbilled and also has $50,000 in AR more than 60 days old points to two separate problems:
- A billing shortfall
- A collections delay
Those issues need different fixes. When billings are off, the next check is whether unpaid invoices have been sitting too long.
Cash Flow Impact
Adding the overbilling and underbilling amounts across all active jobs shows whether cash is running ahead of production or lagging behind it across the company. A net underbilled position usually means cash is tight.
WIP should be updated monthly at minimum. Jobs over $1,000,000 or jobs with thin margins often need biweekly or weekly review. If WIP shows earned revenue moving ahead of billings, the billing report should show exactly where the missing invoices are.
Margin and Profitability Insight
WIP does more than track billing. It also helps compare the original estimated gross margin with the current projected gross margin. Each job should be reviewed using current costs incurred and the estimate to complete, so projected gross profit equals revised contract value minus projected total cost.
When subcontractor overruns or unbilled scope changes push projected costs higher without a matching increase in contract value, margin fade starts to show up. That is direct evidence that the forecast has drifted. A job first budgeted at a 20% gross margin may now be tracking at 12%.
2. Billing by Job and Forecasted Billings Report
Where WIP compares earned revenue with billings, this report focuses on invoice status and timing. It shows what has been sent, what is still pending, and when cash is likely to hit the bank.
Forecast vs. Actual Revenue Visibility
The report begins with a billing plan for each job. That plan may be based on milestones, percent complete, or a Schedule of Values (SOV). It then compares scheduled billings against invoices sent and cash collected.
That side-by-side view makes delays easier to spot. A team can see when a project is billing ahead of plan, falling behind plan, or sitting in limbo between approved work and actual invoicing. It also shows which invoices are already out, which are overdue, and which are still on the schedule.
Forecasting works best when expected delays are built into the numbers. Contract terms alone rarely tell the full story. In many cases, approval takes 30 to 45 days, and payment can take another 30+ days after that.
Job-Level Billing and Collection Tracking
At the job level, the report should show:
- contract value
- approved change orders
- billed to date
- retainage held
- outstanding balance
- days outstanding
- collection status
Payment delays remain a major cash risk in U.S. construction. 82% of contractors report waiting more than 30 days for payment, and average Days Sales Outstanding (DSO) sits at about 90 days.
A steady collection cadence matters here. Regular aging reviews make it easier to catch slow-paying accounts before unpaid invoices turn into a cash crunch.
Cash Flow Impact
The billing by job report becomes far more useful when forecasted billings are tied to expected collection dates. That connection turns billing data into a cash timing tool, not just an invoice log.
Retainage can hold back a meaningful share of cash until closeout. Early visibility into those balances gives contractors time to push for partial releases or shift billing timing where possible. Invoices that remain unpaid then move into the aged A/R review.
3. Aged Accounts Receivable (AR) Report
Once billing goes out, the next issue is simple: does the cash come in on time?
An aged AR report sorts unpaid invoices into time buckets – current, 30, 60, 90, and over 90 days past due – so contractors can see who owes money, how much is still open, and how late each balance has become.
Forecast vs. Actual Revenue Visibility
The aged AR report shows billed revenue that still has not turned into cash. When invoices drift past 60 or 90 days, collected revenue starts lagging behind the forecast. That gap matters fast. About 1 in 4 invoices over 90 days past due becomes uncollectible.
Job-Level Billing and Collection Tracking
Aging by job makes it easier to spot where risk is piling up, especially when combined with job cost tracking to monitor budget health.
Reviewing AR by customer or project shows which jobs are causing collection delays. Retainage should be tracked separately from standard receivables because it follows a different release schedule and can skew the numbers if mixed with regular invoices.
When one job keeps aging, that often points to a dispute, a slow payer, or both. In plain terms, the project forecast may say one thing, while actual collections say something else.
Cash Flow Impact
Construction payment cycles are long. DSO often lands between 62 and 75 days, and 18% to 25% of receivables sit beyond 90 days. That kind of delay can put pressure on payroll, vendors, and job costs at the same time.
Weekly AR aging reviews work better than monthly reviews because they leave more room to act before balances slide into higher-risk territory.
Aging buckets work well as risk flags:
- Current
- 31–60 days
- 61–90 days
- 90+ days
Action taken in the 31–60 day window is usually far easier than trying to collect an invoice that has already gone cold. Balances that keep aging here often show up next as cash flow variance.
4. Cash Flow Forecast vs Actual Cash Flow Report
A cash flow forecast vs. actual report shows whether expected receipts matched what actually reached the bank account. It connects receivables on paper to cash in the bank.
The report compares projected cash inflows and outflows against what moved through the bank ledger during the same period, usually by week or month. The core formula is Starting Cash + Receipts − Disbursements = Ending Cash, applied one period at a time. The variance column matters most because it shows the gap between plan and reality.
Forecast vs. Actual Revenue Visibility
Forecasted revenue and collected revenue are not the same. A contractor can earn revenue and send invoices without receiving the cash if clients have not paid yet. Putting projected billing next to actual receipts makes that timing gap easy to see, and billing delays create direct shortfalls in expected cash receipts.
Job-Level Billing and Collection Tracking
A job-level view makes cash gaps stand out. Company totals can hide trouble that sits inside one project.
Retainage deserves its own line. If 10% is withheld until project closeout, that cash will not appear in near-term inflows. When retainage gets mixed into standard receivables, the forecast can overstate expected cash and create a false sense of comfort.
Cash Flow Impact
The report should flag weeks when outflows are expected to exceed inflows. Payroll, subcontractor payments, and material purchases often land before owner payments arrive. That timing gap between spending and owner payments is built into the business.
Many construction advisors recommend a 13-week rolling cash flow forecast for cash management. A weekly review gives contractors time to use credit, cut nonessential spending, or invoice sooner before one bad week turns into a cash crisis.
If cash stays steady but revenue still trails plan, the next review should focus on earned revenue and percent complete.
Margin and Profitability Insight
A job can show negative cash flow and still have a healthy gross margin. It can also bring in cash fast and still lose money. When cash is the problem, this report shows it. When profit is the problem, the margin report will.
5. Earned Revenue and Percent-Complete Report
After cash timing, the next issue is whether a job has actually earned the revenue on the books. An earned revenue and percent-complete report shows how much revenue comes from work performed, not just from what has been billed or collected.
The cost-to-cost method measures percent complete by dividing costs incurred to date by construction cost estimates, then applying that percentage to the contract value, including approved change orders. A simple example makes it clear: a job with $200,000 in costs against a $400,000 total estimated cost is 50% complete. On a $575,000 contract, that means $287,500 in earned revenue even if none of it has been billed yet.
Forecast vs. Actual Revenue Visibility
The report puts forecasted revenue, based on schedule and budget, beside earned revenue from current percent-complete figures. That side-by-side view exposes schedule drift and productivity problems early. At the job level, the variance column shows each project’s gap against plan, making earned revenue shortfalls visible across the portfolio before month-end close.
Job-Level Billing and Collection Tracking
When earned revenue is compared with billings to date, overbilling and underbilling show up fast on each job. If a project has earned $600,000 but billed $500,000, underbilling is in plain view. The reverse matters too: $750,000 billed against $600,000 earned can help short-term cash flow, but it can also lead to owner disputes when site progress does not support the invoice amounts.
Margin and Profitability Insight
Because earned revenue ties straight to costs incurred, the report also shows current gross margin for every job. A project that is 60% complete with $600,000 in earned revenue and $510,000 in costs is running at a 15% margin – far below a planned 25%. Seeing that gap in the middle of the job gives project teams time to fix scope problems, subcontractor issues, or labor drift before final results are set.
Jobs that earn ahead of billing move next into change order and billing impact review.
6. Change Order Log and Revenue Impact Report
When forecasts drift, change orders are often the cause. A change order log is a central record of every scope change on a project – added work, deleted work, and quantity revisions – along with each change order’s dollar value, status, and billing and collection status. On major construction projects, change orders usually account for 10%–15% of total contract value, and on distressed projects they can reach 25% or more of the original contract. That makes the log a revenue control report, not just admin work.
Forecast vs. Actual Revenue Visibility
The log should split change orders into three categories: approved, pending, and disputed. Approved changes belong in revenue forecasts. Pending items sit in forecasted revenue that has not been secured yet. Disputed items stay out of forecasts until resolved. Without that split, reported revenue can look better than collections will show.
A $50,000 proposed change approved at $45,000 leaves $25,000 still to bill.
Job-Level Billing and Collection Tracking
Approved changes that never get invoiced are a common source of revenue leakage. Industry data shows that 10%–30% of change order work goes unpaid because documentation falls short. Tying each change order to an invoice number, billed amount, collected amount, and aging status makes unpaid approved scope easier to spot.
Cash Flow Impact
Change orders often create a timing gap between costs and collections. If three large change orders totaling $120,000 are approved in September, materials are bought that same month, and payment terms are net 60, the log can show negative cash flow in October and inflow in November.
Margin and Profitability Insight
Each change order should include its own margin calculation: revenue minus direct costs, divided by revenue. That number should be tracked apart from the base contract margin. When total change order margins come in above the original bid margin, job profit improves. When rushed or poorly negotiated changes land below cost, they eat into base margin even while top-line revenue goes up. One cited study linked rework and change orders to a 23% average annual profit loss.
Contractor Foreman can update contract amounts from approved change orders and sync them to job costing and project financials.
If change orders affect revenue, the next check is whether margin moved up or slipped.
7. Job Cost Margin and Profitability Report
A job cost margin report shows whether forecasted revenue actually turns into profit after direct costs. It breaks profit down by project, phase, or cost code, which helps expose weak jobs before they pull down company results.
Forecast vs. Actual Revenue Visibility
Core columns include original contract value, approved change orders, forecasted final revenue, earned revenue to date, billings to date, and remaining revenue to earn. Put side by side, those numbers make margin erosion easier to spot before a job closes.
If a job’s projected final margin drops well below the original bid margin, trouble is usually building somewhere. Labor productivity problems, weak change order pricing, or cost allocation mistakes are common causes. Estimated cost at completion matters most because it shows the projected final profit or loss.
Margin and Profitability Insight
Construction margins are thin. A small overrun can wipe out profit fast.
Projected final margin should be tracked against bid margin, and sharp drops should be flagged early. Many contractors require project managers to explain margin variances in formal review meetings when projected margin falls hard from the bid margin.
Cash Flow Impact
Billings, collections, retainage, and net cash by job should sit in the same view. That way, profitable work that puts pressure on cash shows up early instead of turning into a surprise later.
Contractor Foreman ties job budgets, progress tracking, and billing together so forecasted and actual revenue stay aligned across projects. With QuickBooks sync, labor hours, material purchases, and subcontractor invoices can be assigned to the correct job for a more accurate margin picture.
When margin slips, the cause usually appears first in WIP, billing, receivables, or change orders.
How These Reports Work Together
No single report shows the full revenue picture. These reports work as a chain, moving from production to billing, then AR, and finally cash.
WIP sits at the center. It connects earned revenue to billing, AR, and cash. When earned revenue is higher than billings, that gap should trigger the next progress invoice. Once sent, that invoice moves into AR aging, and the collection clock starts. AR aging then feeds the cash forecast. A 60-day receivable from a slow payer should push expected cash inflow later. That sequence makes it easier to spot where forecasted revenue starts drifting away from actual billing.
Change orders touch every part of the chain. An approved change order updates contract value in WIP, adds to forecasted billings, and later appears in AR and cash flow. When field change orders are not logged, costs climb without matching revenue in every downstream report. When change orders stay current, the revenue chain stays in line.
Margin reports complete the loop. Matching WIP, billing, and margin reports helps surface overruns and underbillings earlier. Construction job costing software margin data, paired with WIP and billing figures, shows whether forecasted revenue is turning into profit.
Construction management software like Contractor Foreman can serve as the central hub for this data instead of leaving it spread across spreadsheets. With a two-way QuickBooks sync, invoices created from progress billing post directly into AR, job costs flow back to the correct project, and WIP, billing, and margin data stay aligned across unlimited projects. That setup makes the next comparison simple: use the same metrics across every report.
Key Revenue Metrics to Compare Across Reports
Compare seven revenue metrics across every job: contract value, earned revenue, billed to date, collected to date, remaining to bill, projected cash inflows, and forecast gross margin.
Contract value, earned revenue, billed to date, and remaining to bill show whether production, invoicing, and collections are moving at the same pace. If those numbers drift apart, something is off.
Collected to date shows the cash actually in hand. A job may look strong on earned revenue and billings, but slow collections mean the cash flow in construction projects remains stagnant. Forecast gross margin rounds out the picture by comparing updated cost forecasts with contract value, which helps spot margin erosion before the job wraps up.
The goal is not to read each report on its own. The same job should be checked across all seven metrics.
The table below shows where each metric comes from.
| Metric | Source Report | Office Build ($) | Retail Center ($) | School Renov. ($) |
|---|---|---|---|---|
| Contract Value | Change Order Log | $2,350,000 | $3,100,000 | $1,450,000 |
| Earned Revenue | WIP Report | $1,410,000 | $930,000 | $725,000 |
| Billed to Date | Billing by Job | $1,525,000 | $860,000 | $690,000 |
| Collected to Date | Aged AR / Cash Receipts | $1,320,000 | $640,000 | $580,000 |
| Remaining to Bill | Billing by Job | $825,000 | $2,240,000 | $760,000 |
| Projected Cash Inflows | Cash Flow Forecast | $980,000 | $1,150,000 | $620,000 |
| Forecast Gross Margin % | Job Cost Margin Report | 18% | 15% | 12% |
These variances show where billing is running ahead of production or falling behind it.
When these metrics split apart, the warning signs stand out fast.
Warning Signs Hidden in Revenue Reports
When these metrics drift apart, trouble shows up fast. Revenue reports do more than log numbers. They surface early signs of revenue slippage.
Underbilling is one of the most common problems hiding in plain sight. It appears when earned revenue is higher than billings to date. In plain terms, work is done but not yet invoiced, and cash gets squeezed.
If collections look fine but revenue still overstates job progress, change orders are often the next place to check. Balances piling up in the 90+ day bucket usually signal disputes, missing backup, or slow payment.
Pending change orders should stay out of revenue forecasts until approval comes through. Counting them too early inflates WIP, earned revenue, and margin.
If billing and collections are current, margin often exposes the deeper issue. A falling gross margin points to cost overruns, estimate gaps, or scope creep.
When revenue looks steady but cash still comes up short, timing is often the problem inside the forecast. If actual cash trails the billing schedule, the forecast is too aggressive and working capital tightens.
Conclusion
No single metric shows revenue health. Forecasted, earned, billed, and collected revenue need to be checked together. These seven reports function as one system, not seven separate dashboards.
A forecast can look fine at first glance while underbilling, unapproved change orders, and margin erosion build in the background. The full picture appears only when all seven reports are reviewed together.
The most useful review schedule is simple:
- Review WIP, billing, and change orders weekly.
- Review AR, cash flow, earned revenue, and margin monthly.
Cash flow and margin depend on steady review and fast action when variance appears. Forecasts remain reliable only when they are reconciled against billing, collections, and approved scope changes.
Contractor Foreman centralizes WIP, change orders, invoicing, and AR, with QuickBooks integration to keep revenue data aligned.
Used together, these reports keep forecasted revenue tied to actual job performance.
FAQs
Which report should I check first?
Start with the Job Cost Actual Report (Detailed). It brings labor, equipment, bills, expenses, and income into one place, so a project’s financial health is easier to see at a glance.
It works well for comparing the estimated budget against actual costs, contract value, and profitability. For a broader look, the financial dashboard shows high-level KPIs such as profit margins and cash flow.
How often should contractors review these reports?
Review these reports on a steady schedule to keep projects healthy. Weekly checks of budget-versus-actual, cost-to-complete, and cash flow reports help spot profit leaks or overruns early, before they turn into bigger problems.
During busy phases, labor and material costs may need daily monitoring. Project profit and loss should be reviewed monthly. Forecasts should be updated right away when change orders or material delays shift the plan.
Why do earned revenue and cash collected differ?
They differ because each follows a different timeline. Earned revenue reflects work already completed. Cash collected, on the other hand, usually follows the contract’s billing schedule, not the date the work happened.
Client payment timing and internal payment terms can widen that gap. As a result, cash received in a given period often doesn’t match the value of work completed during that same period.