
“How productive were you today?”
It’s a simple question, right? But not quite in construction!
That’s because there are different types of construction jobs — residential, commercial, industrial, trade-specific — and each one answers that question differently. And, of course, there are different job types that can’t simply be measured the same way.
Ask a framer on a residential build, and the answer is square footage of drywall per hour. Ask a super running a commercial job, and it’s earned vs. burned hours. Ask a crew on an industrial pour, and it’s cubic yards per crew-day. Same question, three completely different answers — because the work itself isn’t the same.
Construction productivity benchmarks change by job type, phase, crew mix, and site conditions.
Here’s how to apply the benchmarks in four steps:
- Track output by task or cost code
- Check earned hours against burned hours
- Review planned vs. actual progress each week
- Use PPC to separate planning misses from field misses
| Job Type | Best-Fit Benchmark | Main Risk to Watch | Best Review Pace |
|---|---|---|---|
| Residential | Unit rate by task | Weather, crew mix, project type | Weekly |
| Commercial / Institutional | Earned vs. burned hours + PPC | Trade stacking, access, congestion | Weekly |
| Industrial / Heavy | Quantity per crew-day | Weather, equipment downtime, sequence | Weekly |
| Trade-Specific | Unit rate by cost code | Bad field entry, phase drift, rework | Weekly |
Key takeaway: match the metric to the job type.
Benchmarks work best when field time and cost codes are logged on-site, labor codes stay limited, and weekly variance reviews catch drift before it turns into margin loss.
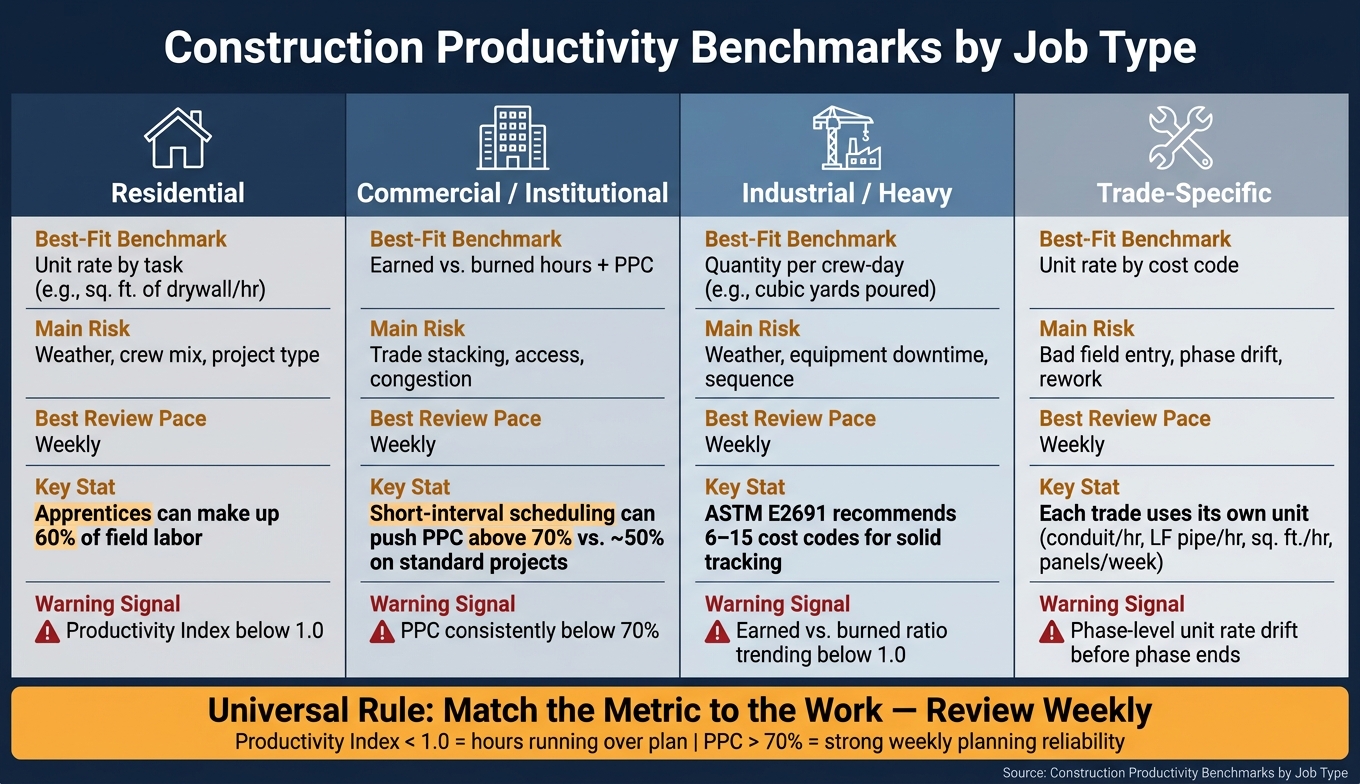
Construction Productivity Benchmarks by Job Type
1. Residential Building Construction
Residential benchmarks are highly variable, driven by home type, project phase, and weather. Repeatable tasks — like hanging drywall — are far easier to measure than one-off work, and cold weather can reduce daily concrete output. As a result, unit-level tracking provides more reliable insight than broad crew averages.
Labor Output Benchmarks
The most useful residential benchmarks tie back to specific cost codes, like square feet of drywall hung per labor hour or cubic yards of concrete poured per crew-day. That gives you a cleaner view of what’s happening in the field.
One metric stands out here: the Productivity Index, which compares earned hours to burned hours. If burned hours run higher than earned hours, the ratio drops below 1.0. That’s a warning sign. It usually points to a margin issue and tells you it’s time to review cost-to-complete.
Crew Pace and Specialization
Residential crews often lean heavily on apprentices. In some cases, apprentices make up as much as 60% of field labor. That can help keep bill rates lower, but there’s a tradeoff. Crews like this often need tighter sequencing and closer supervision to keep output steady.
So no, lighter labor cost doesn’t mean you can be loose with tracking. If anything, it means the opposite. Field capture matters more.
Reporting and Tracking Methods
The biggest reporting problem in residential work is backfilled timesheets. They look fine on paper, but they can hide what actually happened. Time and cost codes should be captured in the field, as the work happens.
Contractor Foreman supports that with:
- GPS-driven timecards
- Daily logs
- Mobile access for on-site entry
That setup helps crews record data on the jobsite instead of trying to piece it together later.
Variance Review KPIs
For residential work, a weekly review cadence makes the most sense. Daily reviews can create too much noise. Monthly reviews are often too late to fix anything.
Use these weekly KPIs:
| KPI | What It Measures | Residential Example |
|---|---|---|
| Unit Rate | Output per labor hour | Square feet of drywall hung per hour |
| Earned vs. Burned | Bid hours vs. actual hours | Productivity Index for a framing phase |
| PPC | Completed tasks ÷ committed tasks | Weekly framing or rough-in schedule reliability |
| Planned vs. Actual | Units installed vs. schedule | Electrical fixtures installed by week 3 |
PPC helps show whether a miss came from planning or from crew execution. Planned versus actual unit progress shows whether the schedule is still holding at the task level. Review these KPIs each week, and you have a much better shot at spotting variance early before it snowballs into the next phase.
As projects get larger and involve more coordination, these same benchmarks still matter, but you have to read them through a different lens.
sbb-itb-5eea312
2. Commercial and Institutional Building Construction
Commercial and institutional jobs run on a very different scale than residential work. There are more trades to line up, more people in the mix, and longer review cycles. That changes how productivity should be measured. On these projects, raw output matters, but coordination and phase control matter just as much.
Labor Output Benchmarks
In commercial and institutional construction, teams often track output by phase. That can mean measures like beds installed per labor hour or square feet of partition wall finished per crew-hour. For field tracking, phase-based unit rates tend to work best.
Why? Because site logistics can change fast. On a high-rise, trade stacking, access limits, and material movement can all shift production from one day to the next. A single top-line number usually misses that.
Crew Pace and Specialization
Commercial scopes are usually split into specialized trade packages, so schedule reliability becomes just as important as output. Specialization can make unit rates more steady, but it can also create more coordination risk when one crew’s delay slows down everyone behind them.
That’s where Percent Plan Complete (PPC) helps. It shows how reliably each trade meets its weekly promises. A crew at 90% PPC is more dependable from week to week than one at 50%, even if their unit rates look close on paper.
Short-interval scheduling can push PPC above 70%, compared with roughly 50% on more standard projects.
Reporting and Tracking Methods
One of the biggest reporting problems on commercial jobs is simple: data gets rebuilt at the end of the week instead of logged in the field. Once that happens, your benchmark stops being field data and starts becoming an estimate.
Contractor Foreman supports source-level capture with construction daily logs and GPS-driven timecards, so foremen can log time and cost codes on-site as the work happens. On jobs with several labor codes, that makes a big difference in keeping benchmark data honest.
Variance Review KPIs
This is why commercial benchmarks work better when they’re split by scope. A commercial project should be broken into clear phases – Rough-In, Wire Pull, Panel & Switchgear, and Trim-Out – because each phase has its own production metric and its own risk pattern. Looking only at a top-level labor budget line can bury the real issue.
| Commercial Phase | Key Production Metric | Primary Risk Factor |
|---|---|---|
| Rough-In | Linear feet of conduit per crew-day | Field condition deviations, change order exposure |
| Wire Pull | Linear footage per crew-hour by wire gauge | Conduit routing friction, undersized crews |
| Panel & Switchgear | Hours per panel/location | Scope creep, late-stage change orders |
| Trim-Out | Devices/fixtures installed per hour | Punch list absorption, trade congestion |
When you pair those phase metrics with reason codes for missed tasks, the picture gets much sharper. If the delay came from materials or missing design info, that points to a planning problem. If the plan was sound and the work still slipped, the issue is more likely in execution.
3. Industrial and Heavy Construction
Industrial and heavy construction runs on a different level.
Jobs are bigger, sequencing can make or break the schedule, and margins get tight fast. Because of that, benchmarks have to go deeper than broad crew averages. On these projects, task-level rates, equipment use, and work sequence tell you far more than a simple average ever could. Across labor output, crew pace, reporting, and variance review, the bar is higher and the tracking has to be tighter.
Labor Output Benchmarks
Residential and commercial projects often begin with simple units like square feet. Industrial and heavy work usually can’t. It makes more sense to track output with task-based measures like cubic yards of concrete poured per crew-day or linear feet of pipe set per hour. A benchmark based on drywall square footage doesn’t tell you much on a heavy industrial site.
One of the strongest industrial benchmarks is the Productivity Index. It compares earned hours to burned hours. If that ratio slips below 1.0, the crew is using hours faster than it is earning them.
Crew Pace and Specialization
Crew pace on industrial jobs changes more sharply with jobsite conditions than it does in residential or commercial work. Output can move up or down because of access limits, layout, equipment, and weather, not only because of crew skill.
That’s why industrial scopes need crew-based estimating. Rate the crew, the labor mix, and the equipment as one working unit instead of judging each worker on their own. If production slows, the problem may be the task mix or the site layout, not the people doing the work.
Reporting and Tracking Methods
Time and cost codes need to be recorded in the field. Rebuilding weekly productivity from memory is a bad bet. ASTM E2691, the published standard for job productivity measurement, recommends breaking labor activity into six to fifteen cost codes for solid tracking.
Contractor Foreman supports this kind of source-level capture through mobile daily logs and GPS-driven timecards. That gives foremen a way to assign cost codes on-site, while work is happening, instead of trying to piece it together later. Without source-level capture, variance review loses much of its use.
Variance Review KPIs
| KPI | What It Measures | When to Act |
|---|---|---|
| Earned vs. Burned Hours | Ratio of bid-value hours to actual hours logged | When the ratio trends below 1.0 |
| Percent Plan Complete (PPC) | Reliability of weekly crew commitments | When weekly commitments are repeatedly missed |
| Unit Rate by Cost Code | Output per hour or crew-day for a specific task | When a task drifts from internal historical performance |
| Planned vs. Actual Progress | Field reality versus the original weekly target | When installed quantities consistently lag the plan |
When variance review points to an underperforming crew, the next move is usually pretty direct: swap personnel, move a high-performing foreman onto that crew, or change the work sequence. The point is to tell the difference between a crew problem and a package-level problem in trade work.
4. Trade-Specific Work Packages
Trade work is the most detailed benchmark category. You track output by task, phase, crew, and cost code. That’s why phase-level and cost-code benchmarks tell you more here than blended job averages ever could.
Labor Output Benchmarks
Every trade has its own natural unit of measure. Use the wrong one, and the data loses a lot of its value. Electrical work is tracked by conduit installed per hour. Concrete is measured by cubic yards poured per crew-day. Drywall uses square feet hung per hour. Mechanical and plumbing work are tracked by linear feet of pipe set per hour. Solar jobs are often measured in panels mounted per crew-week.
Don’t mix units across trades. That only muddies the picture. Drywall is a good example: productivity often drops on high-rise projects compared with standard builds. The unit stays the same, but the benchmark changes with the job conditions.
Crew Pace and Specialization
Phase has more to do with crew pace than trade label alone. Electrical work makes that plain. During Rough-In, crews are usually measured by linear feet of conduit per crew-day. It’s a high-output phase. By Trim-Out, the same crew may be dealing with punch list work, tighter spaces, and interference from other trades. Output slows down, and that’s normal.
Plumbing and mechanical scopes follow the same pattern. Rough-In and Trim-Out need different benchmark baselines, so each phase should be compared against its own past rate.
Reporting and Tracking Methods
Bad data can throw off trade benchmarks more than the crew’s actual performance. Foremen should log time and cost codes in the field, while the work is happening. Contractor Foreman’s mobile daily logs and GPS-driven timecards support source-level capture, which helps foremen assign cost codes on-site. It also helps to use a separate cost code for punch list and warranty callbacks instead of lumping that time into primary installation. That keeps rework from warping the production benchmarks that matter most.
Once the data is logged at the source, a weekly variance review starts to mean something.
Variance Review KPIs
| KPI | What It Measures | Trade Application |
|---|---|---|
| Unit Rate by Cost Code | Output per hour or crew-day for a specific task | Conduit/hr, sq. ft./hr, LF of pipe/hr |
| Earned vs. Burned Hours | Bid-value hours vs. actual hours logged – ratio below 1.0 flags margin loss | Flags margin loss before closeout |
| Percent Plan Complete (PPC) | Weekly task commitments met vs. planned | Exposes planning gaps, not just crew gaps |
| Planned vs. Actual Unit Progress | Installed quantities vs. weekly targets | Catches phase-level drift early |
A weekly review cadence is the right interval for trade packages. It gives you enough time to spot phase drift before it turns into rework or missed production. The point is simple: catch unit-rate drift early enough to adjust crew mix or sequence before the phase is over.
Pros and Cons by Job Type
Different job types reward different controls. Sometimes the big issue is repetition. Other times it’s coordination, uptime, or clean cost-code tracking. The table below shows which benchmark fits each job type and why.
Strengths and Limits Comparison Table
| Residential | Commercial / Institutional | Industrial / Heavy | Trade-Specific | |
|---|---|---|---|---|
| Key Advantages | Repeatable assemblies produce steadier historical averages. | A standardized work breakdown structure improves cross-project tracking. | Large quantities make unit tracking cleaner. | Granular cost codes improve margin control. |
| Key Disadvantages | High-rise logistics can distort standard rates. | Dense trade stacking raises coordination risk. | Weather and equipment downtime drive the largest swings. | Source-level field entry is required. |
| Best Benchmark Format | Labor hours per unit, such as sq. ft. per hour. | Earned vs. burned hours ratio, plus PPC. | Quantity per crew-day. | Unit rate by cost code. |
| Common Variance Causes | Crew skill mix; single-family vs. high-rise project type. | Site congestion, elevator wait times, and subcontractor manpower. | Winter weather and equipment fleet maintenance. | Inaccurate field reporting; layout and testing delays. |
When Each Benchmarking Approach Works Best
Use the table above to match the benchmark to the main source of variance. That’s the part that matters most. A metric can look good on paper and still be the wrong fit for the job.
Residential: Use residential benchmarks for repeatable assemblies and similar project types. Compare like with like. A single-family build and a high-rise tower may both be “residential”, but labor patterns can be very different.
Commercial and institutional: Use earned vs. burned hours and PPC when coordination risk matters more than raw output. On these jobs, congestion, sequencing, and trade overlap can throw off a simple production rate.
Industrial and heavy: Use quantity-based benchmarks when equipment uptime and weather drive production swings. If machines sit idle or the weather turns bad, daily output can move fast.
Trade-specific: Use trade-package benchmarks only when crews log time and cost codes at the source. If field reporting is off, the benchmark won’t tell you much.
That comparison leads directly into the final takeaway: match the metric to the work.
Conclusion
Across residential, commercial, industrial, and trade work, benchmark quality comes down to the unit you choose, how data gets captured in the field, and how often the team reviews it. Residential, commercial, industrial, and trade work each call for different unit measures, crew controls, reporting habits, and variance reviews.
Key Takeaways
Across all four job types, the same pattern shows up: what you measure, how you capture it, and how often you review it. A Productivity Index below 1.0 and a low PPC both point to margin and planning risk. That problem tends to show up most when timesheets are rebuilt from memory instead of logged in the field.
That’s why the right benchmark matters more than a broad average.
Match the Metric to the Work
Match the unit to the work package, then review it weekly.
Contractor Foreman brings field and cost reporting into one place so crews can assign cost codes at clock-in, keep daily logs up to date, and send trusted data into job costing.
FAQs
How do I choose the right benchmark for my job type?
Start with internal benchmarks based on your past project data instead of leaning only on industry averages. Use measurable work units like square feet installed or units completed per hour, then connect those numbers to verified labor hours with consistent cost codes.
Review this data weekly so your targets match your actual work mix, job locations, and crew makeup. Contractor Foreman makes this easier by centralizing labor tracking and daily logs, which helps you spot trends and variances as they happen.
What does a Productivity Index below 1.0 mean?
A Productivity Index below 1.0 means a crew is burning through labor hours faster than it’s earning them against the budgeted work. Put simply, the team isn’t hitting the planned production rate for that task.
For a project manager, that’s a clear sign to step in and look at what’s causing the slowdown. Common issues include inefficient workflows or resources being used in the wrong place. From there, the fix might be as simple as shifting personnel or changing the work sequence.
Why is weekly review better than monthly tracking?
Weekly review works better because it gives teams an early warning system while the job is still moving. It helps them spot budget overruns, labor inefficiencies, and scheduling bottlenecks before those issues spread across the project.
Monthly tracking looks backward more than forward. By the time a problem shows up there, it may have already cut into margins or pushed the schedule off track. Weekly reviews support more active management and help teams catch variances before they turn into losses.
Related Blog Posts
- Real Data That Drives Residential Construction Decisions
- Shift Productivity Metrics for Construction Teams
- 5 Costly Estimating Mistakes Small Contractors Make
- Construction Progress Tracking: Ultimate Guide