- What Makes a Construction BI Dashboard Useful
- 1. Executive Insights Dashboard
- 2. Project Performance Dashboard
- 3. Financial Health and Cost Dashboard
- 4. Schedule and Milestone Dashboard
- 5. Resource and Workload Dashboard
- 6. Progress and Field Activity Dashboard
- 7. Bids and Proposals Dashboard
- 8. Predictive Analytics Dashboard
- Comparison Table
- Conclusion
- FAQs
How many times have you found out a project was over budget via a panic text at 6am? Or been “the last to know” about a two-week delay — again?
Sure, you can deal with the stress, but what really stings is that if you tally all the damage caused by these preventable blunders, it could easily reach $50,000 or more — money you could have reinvested back into your business, or you know, finally bought that boat you keep telling yourself you don’t need but most definitely need!
Here’s the thing: construction management doesn’t just mean being good at organizing and solving problems.
First and foremost, you gotta have visibility. Budgets, schedules, and resources get scattered across spreadsheets, inboxes…and of course, you’re not just managing one project — you’re juggling 2-3 at a time. Even the most organized manager can’t catch what’s coming if they’re working on data that’s not up to date.
Business Intelligence (BI) dashboards fix exactly that. They pull everything into one place and give you real-time insights (some packaged in lovely charts) so you can see the full picture— where your cash flow actually stands, whether a project is slipping off schedule, and which resources are stretched too thin, and a whole lot more you didn’t even know you were missing.
Here’s a quick overview of the most effective BI dashboards tailored for residential construction teams:
- Executive Insights Dashboard: Provides company-wide performance metrics for leadership to identify financial and operational risks.
- Project Performance Dashboard: Focuses on tracking individual project progress, budgets, and schedules to address issues early.
- Financial Health and Cost Dashboard: Offers detailed cash flow and profitability data to ensure financial stability.
- Schedule and Milestone Dashboard: Tracks project timelines and critical paths to avoid delays.
- Resource and Workload Dashboard: Helps allocate labor and equipment efficiently, reducing bottlenecks.
- Progress and Field Activity Dashboard: Monitors daily on-site accomplishments with real-time updates.
- Bids and Proposals Dashboard: Streamlines pre-construction processes, improving bid management and win rates.
- Predictive Analytics Dashboard: Uses data to forecast risks and challenges, enabling proactive decision-making.
Each dashboard addresses specific challenges in construction management, from financial clarity to on-site productivity. The right choice depends on your team’s goals, whether it’s improving cash flow, meeting deadlines, or enhancing resource allocation.
For smaller contractors, tools like Contractor Foreman offer integrated solutions starting at $49/month, combining multiple dashboards into one accessible platform.
What Makes a Construction BI Dashboard Useful
Not every dashboard is designed with the unique demands of construction in mind.
While some generic dashboards may look sleek, they often fall short when it comes to connecting job costing data with field logs. This disconnect can render them impractical for day-to-day use. The most effective construction BI dashboards, however, share a few key features that make them genuinely practical and impactful.
It all starts with data consolidation. A truly useful dashboard integrates information from the tools you’re already using – whether it’s accounting software like QuickBooks or Sage, project management platforms, or field apps – into one cohesive view. Without this integration, you’re stuck toggling between screens and manually piecing together data. Specialized BI tools eliminate this hassle, making decision-making far more efficient. A unified data setup also ensures quicker insights, especially for field teams.
Real-time visibility is another must-have. When field data updates automatically, managers can address issues as they arise. This kind of responsiveness can make the difference between minor setbacks and major problems.
Sarah Jensen, Owner of Jensen Residential Builders, highlighted this point perfectly:
“The real-time visibility is a game changer. I caught a budget issue on a Tuesday that would’ve been a Thursday disaster with our old system.”
Speed is crucial, but it’s equally important for dashboards to focus on the metrics that matter most in construction. These include construction cost estimates vs. actual spend, Work-in-Progress (WIP) schedules, labor utilization, milestone tracking, and cash flow forecasting. These aren’t just helpful extras – they’re the critical indicators of a project’s health and progress.
Lastly, role-based access is more important than many realize. Field crews need task-specific details, while executives require an overview of financial performance. A one-size-fits-all dashboard often ends up being ignored because it doesn’t meet anyone’s needs. The dashboards discussed below are tailored to specific roles within construction management, ensuring that every team member gets the information they need to do their job effectively. This role-based approach is the foundation for the detailed dashboards explored in the next section.
sbb-itb-5eea312
1. Executive Insights Dashboard
Primary Use Case
The Executive Insights Dashboard offers leadership a streamlined, unified view of company-wide performance, eliminating the need to switch between multiple data sources.
It consolidates financial, scheduling, billing, and labor data from all active projects, focusing on key performance indicators. By prioritizing early detection of potential issues, this dashboard shifts the focus from traditional reactive reporting to proactive oversight. This approach enables leaders to identify and address challenges before they escalate.
Key Metrics Tracked
This dashboard provides executives with access to critical metrics, including:
- Budget versus actual costs
- Cost Performance Index (CPI) and Schedule Performance Index (SPI)
- Net cash position and Work-in-Progress (WIP) balances (covering overbilling and underbilling)
- Pending and approved change orders
- Accounts receivable aging and retainage held
- Sales pipeline data, such as backlog value in dollars and months of capacity
With capital projects often exceeding budgets by 79% and running 52% behind schedule compared to initial estimates, having these metrics available in real time allows leadership to intervene before problems grow.
Best Fit for Construction Teams
This dashboard is tailored for owners, CEOs, CFOs, and COOs managing multiple projects simultaneously. It’s particularly beneficial for contractors with annual revenue between $20M and $100M, where fragmented data across various jobs can create significant obstacles. Business development teams also gain value by leveraging the integrated view of the sales pipeline and backlog, enabling better strategic planning.
Visualization Features
The best executive dashboards combine high-level portfolio metrics with detailed drill-down capabilities and exception-based alerts. These features allow executives to move seamlessly from an overview – such as gross margin or cash position – to specific job-level details like cost code variances. Automated alerts for budget overruns or delayed billings ensure leaders stay ahead of potential issues rather than reacting after the fact. Companies using such business intelligence tools are five times more likely to make quicker decisions and three times more likely to see those decisions executed effectively.
| Visualization Feature | Executive Benefit | Data Source |
|---|---|---|
| Drill-Down Charts | Links enterprise KPIs to specific field events | ERP/Field Reports |
| Color-Coded AR Aging | Identifies collection risks at a glance | Accounting Software |
| Custom Metrics Cards | Highlights crucial data like SPI and finish variance | Schedule Data |
| Interactive Trend Lines | Tracks performance over time for benchmarking | Historical Project Data |
2. Project Performance Dashboard
Primary Use Case
While the Executive Insights Dashboard provides a bird’s-eye view of the company, the Project Performance Dashboard focuses on the finer details of individual projects. It tracks schedules, costs, and resources in real time, helping teams identify and address issues before they spiral out of control. The aim here is not just awareness but actionable insights.
“Just as one wouldn’t drive a car without a dashboard… no construction project manager should try to deliver construction projects without a construction project dashboard.” – William Malsam, ProjectManager.com
The stakes are high: in 2020, bad data cost the global construction industry a staggering $1.8 trillion. Inaccurate reporting alone accounted for 14% of rework and $88.69 billion in unnecessary expenses. A well-designed performance dashboard tackles this problem head-on by replacing manual, error-prone reporting with automated, real-time data. This approach ensures early problem detection, offering a clear focus on the metrics that matter most.
Key Metrics Tracked
To stay effective, a dashboard should focus on 5–8 core KPIs, keeping the data clear and actionable. Each KPI should be easy to understand, ensuring that teams can act quickly without confusion.
These KPIs typically fall into four major categories:
| Metric Category | Key KPIs | Why It Matters |
|---|---|---|
| Schedule | Percent Planned Complete (PPC) vs. Actual, Milestone Variance | Helps identify delays before they impact the critical path |
| Financial | Budget vs. Actual, Profit Variance, Change Order Capture | Pinpoints areas where profit margins are at risk |
| Labor | Hours vs. Estimate, Overtime % | Tracks crew efficiency and helps manage payroll costs |
| Cash Flow | WIP (Underbilling/Overbilling), AR over 60 days, Retainage | Ensures steady cash flow and timely billing |
Tools like Contractor Foreman simplify WIP reporting, making it easy for managers to stay informed.
Best Fit for Construction Teams
This dashboard is tailored for project managers and field supervisors who want to shift from being reactive to taking proactive control. It’s especially beneficial for projects where labor productivity and timely billing are critical to profitability. With 75% of construction firms highlighting the need for faster decision-making in the field, having access to live project data – rather than outdated spreadsheets – is no longer optional; it’s essential.
Visualization Features
The best Project Performance Dashboards come equipped with tools that make complex data easy to interpret. Gantt charts help track timelines and dependencies, while S-curves compare planned versus actual progress over time. Kanban boards provide a clear view of tasks waiting for approval versus those in progress. Color-coded alerts and KPI gauge cards let managers assess project health in seconds, making morning check-ins more efficient. For teams juggling multiple projects, drill-down charts enable a quick shift from high-level trends to specific cost codes or crew performance. This kind of visualization speeds up root-cause analysis, empowering teams to act decisively.
3. Financial Health and Cost Dashboard
Primary Use Case
While the Project Performance Dashboard focuses on tracking how a job is progressing, the Financial Health and Cost Dashboard is all about profitability. It delivers a real-time breakdown of cash inflows and outflows, making it easier to determine if a project is financially viable. This live data helps teams pinpoint cash gaps, safeguard profit margins, and predict shortfalls to ensure payroll and other operations run smoothly. In essence, performance dashboards handle day-to-day progress, while this financial view hones in on the bottom line.
Key Metrics Tracked
This dashboard consolidates critical financial metrics that reveal whether a project is on track to meet its financial goals. Here are some of the key metrics:
| Metric | What It Reveals |
|---|---|
| Billing Alignment | Ensures billing corresponds to the work completed |
| AR Aging (30/60/90+ days) | Identifies overdue invoices |
| Committed Costs | Tracks subcontracts and purchase orders issued but not yet paid |
| Cash Flow Forecast | Provides a 30-, 60-, and 90-day outlook to plan for payroll and purchases |
Best Fit for Construction Teams
This dashboard is particularly useful for construction professionals who need financial clarity without hiring a full-time CFO. It’s tailored for general contractors, custom home builders, remodelers, and specialty trades with annual revenues between $500,000 and $50 million. Contractor Foreman offers these financial insights starting at $49/month, with tools to track both committed and actual costs across unlimited projects.
Proper job costing is a must for any successful contractor. Our job costing reports make it easy for you to see your Committed and Actuals and to see if things are getting off track.
Visualization Features
A strong financial dashboard combines clear summaries with detailed drill-down options. Managers can quickly review the overall net cash position and trace specific figures back to their source, like invoices or cost codes, to streamline cost calculations. Features like color-coded AR aging buckets make it easy to spot overdue accounts, while automated WIP schedules help cut month-end closing times to just 2–3 days.
For teams using QuickBooks, the real-time sync ensures the dashboard stays up-to-date, eliminating the hassle of manual data entry.
“The integration of the whole platform is very good, including externally with QuickBooks Online… The apps are really feature heavy for a construction software.” – Chuck A., Liercke Construction, LLC
4. Schedule and Milestone Dashboard
Primary Use Case
While the Financial Health and Cost Dashboard helps determine if a project is profitable, the Schedule and Milestone Dashboard focuses on whether the project will finish on time. It offers a real-time snapshot of project progress, eliminating the need to wade through complicated Gantt charts or chase updates. This tool emphasizes time management, complementing the financial and performance metrics covered earlier.
Each morning, project managers can quickly check the dashboard to identify milestones due, tasks lagging behind, and activities on the critical path – the sequence of tasks that directly impacts the project’s completion date. Delays here ripple through the entire timeline. According to McKinsey, large construction projects typically exceed their schedules by 20%, and a KPMG survey revealed that only 31% of organizations deliver projects within 10% of their original deadlines. A well-designed schedule dashboard flags delays early, helping teams address issues before they escalate.
Key Metrics Tracked
The best schedule dashboards prioritize exceptions – highlighting delays, risks, or upcoming deadlines – rather than overwhelming users with every scheduling detail.
| Metric | Why It Matters |
|---|---|
| Baseline vs. actual finish dates | Quickly reveals where slippage has occurred. |
| Schedule variance (in days) | Shows how far ahead or behind milestones are. |
| Critical path & total float | Identifies tasks where any delay affects the project’s end date. |
| Milestone status (On Track / At Risk / Late) | Offers a visual health check using traffic-light indicators. |
| 7/14/30-day look-ahead | Highlights upcoming tasks, inspections, and permit deadlines. |
| Liquidated damages exposure | Estimates financial penalties if contractual deadlines are missed. |
For U.S.-based projects, aligning these metrics with key contractual milestones – like Substantial Completion or TCO issuance – ensures teams stay focused on binding obligations rather than just internal timelines.
Best Fit for Construction Teams
Having a consolidated view of milestones and timelines is a game-changer for teams juggling multiple projects. This dashboard is particularly useful for general contractors managing several jobs simultaneously. With lean office teams spread thin, there’s rarely time to comb through every detail. A high-level milestone overview allows project managers or operations managers to quickly assess priorities and direct attention where it’s most needed.
Contractor Foreman supports this need with built-in scheduling tools, including Gantt-style schedules, task dependencies, baseline tracking, and calendar views, all accessible via web and mobile devices. Starting at $49/month, it’s a practical choice for small to mid-size contractors seeking clear schedule visibility without the expense of enterprise-level software.
With baseline tracking, you’ll know what is taking more (or less) time than scheduled allowing you to better adjust and maximize your time.
Visualization Features
As with the Executive and Project Performance Dashboards, clear visualization is crucial for effective decision-making in the Schedule Dashboard. The best tools offer multiple data views to suit different roles. Executives benefit from a high-level milestone tracker with RAG (Red/Amber/Green) indicators. Project managers can dive deeper into related RFIs, change orders, or constraints that explain delays. Field crews, on the other hand, rely on simple weekly task lists filtered by trade or location.
The Gantt view is great but there are times where you need to see a normal calendar view or a list view. Select the view that best fits your role.
Features like trend charts showing forecast completion shifts over time, paired with a 30-day look-ahead widget, help teams plan labor, materials, and inspections efficiently.
5. Resource and Workload Dashboard
Primary Use Case
The Resource and Workload Dashboard takes scheduling insights a step further by helping project managers allocate labor and equipment more effectively. It balances resources, forecasts staffing needs, and identifies bottlenecks before they impact profitability. Instead of relying on individual foremen to confirm availability, managers can instantly see which crews are overworked, underutilized, or where staffing gaps might arise. With 92% of experienced contractors agreeing that specialized tools improve labor forecasting, this dashboard is a game-changer for operations.
Key Metrics Tracked
The best resource dashboards simplify labor and equipment management by focusing on key metrics:
| Metric Category | Key Data Points |
|---|---|
| Labor Efficiency | Total hours, overtime hours, production rate (units/hr), variance vs. budget |
| Staffing Health | Available headcount, assigned headcount, shortfalls or surpluses, skill matching |
| Equipment Management | Utilization rate, idle time, maintenance status, owned vs. rented costs |
| Schedule Risk | Overdue tasks, critical path tasks, over-allocated resources |
One critical area to monitor is overtime. Unchecked overtime and double-overtime can quickly blow budgets. Real-time labor tracking is essential – waiting until month-end to discover overruns is too late. This is especially important when errors in data and reporting contribute to 14% of construction rework, costing the industry an estimated $88.69 billion globally.
Best Fit for Construction Teams
This dashboard is particularly useful for teams managing complex, multi-site operations. Specialty contractors handling numerous short-term projects and general contractors managing large-scale, multi-phase programs will find it indispensable. For lean office teams with crews spread across multiple locations, manually tracking resources is simply not practical.
Tools like Contractor Foreman address these challenges with features such as GPS-enabled timecards and mobile clock-ins. These feed accurate, real-time labor data into reports, offering smaller contractors an affordable option at $49/month. This ensures resource visibility without requiring costly enterprise systems.
“We’re all in a labor shortage and running lean. We can feel more comfortable running lean if we can understand where our people are, how long they’re going to be there, and what that strategy looks like.” – Teryn Lamoreau, Operations Support Director, Jaynes Corporation
Visualization Features
A well-designed dashboard caters to various decision-making needs by layering multiple views. Interactive maps show where crews and equipment are deployed, providing a clear geographic perspective for logistics decisions. Color-coded variance indicators (green/yellow/red) help managers quickly spot teams that are over budget or behind schedule.
Drill-down features make the dashboard even more powerful, allowing users to transition from a portfolio-wide view to detailed site-level data, such as individual timesheets or specific task assignments. Automated alerts for cost overruns or production slowdowns turn the dashboard into an early-warning system.
“A well-designed dashboard should surface problems instantly without digging through reports, helping site supervisors spot delays or issues during daily reviews.” – George Ali, CTO, Code Creators
6. Progress and Field Activity Dashboard
Primary Use Case
This dashboard goes beyond tracking schedules and resources – it confirms daily, on-site accomplishments. While tools like the Resource and Workload Dashboard show where your teams and equipment are, the Progress and Field Activity Dashboard focuses on what’s being achieved. Its purpose is straightforward: it gives project managers real-time updates on field progress, eliminating the need to wait for a foreman’s call or weekly reports.
Field crews use mobile devices to log labor hours, material deliveries, safety meetings, and site conditions. This data flows instantly to the office, replacing manual reporting with automated, real-time records. Considering that 75% of construction firms need quick decision-making in the field, and 80% of major projects still face budget overruns, these instant insights are crucial. The dashboard organizes this information into key performance metrics, which are explained below.
Key Metrics Tracked
The dashboard tracks critical metrics that connect field activity to overall project performance:
| Metric Category | Key Data Points |
|---|---|
| Work Completion | Percent complete by task, trade, floor, or zone |
| Labor Accountability | Hours logged by cost code, employee, and job site |
| Material Status | Quantities ordered, delivered, and backordered |
| Delay Documentation | Weather conditions (auto-logged), schedule notices, external factors |
| Safety & Compliance | Safety meeting records, incident reports, and inspection status |
One standout feature is automated weather logging. Instead of relying on manual entries for delays caused by rain or other weather conditions, the dashboard pulls local weather data automatically. This ensures accurate and objective documentation for weather-related delays.
Best Fit for Construction Teams
This dashboard is especially useful for project managers, superintendents, and owners who need concise progress updates at the trade level. It reduces the need for constant phone calls or site visits.
Contractor Foreman is an example of a tool that supports this workflow. It offers daily logs, GPS-enabled timecards, and a client portal that shares progress photos and updates automatically. Starting at $49/month, it’s a budget-friendly option for smaller teams.
Visualization Features
Visual tools make it easier to interpret field progress by organizing updates in a clear and intuitive way. For example, color-coded zones on floorplans allow superintendents to quickly identify completed, in-progress, or delayed work. Kanban boards provide another layer of clarity, sorting tasks and change orders by status – so it’s clear what needs approval and what’s actively progressing.
For teams using 360° site capture tools, the dashboard can link these images directly to floorplans. This adds a spatial context that static photos simply can’t provide.
7. Bids and Proposals Dashboard
Primary Use Case
Winning bids in the construction industry is no small feat. On average, general contractors convert only 17% of their bids into project wins – essentially one win for every six bids submitted. With competition ramping up (bids have surged by 36% since the pandemic began), staying organized is more critical than ever.
A Bids and Proposals Dashboard serves as a central hub for managing active bids, vendor responses, and upcoming opportunities. Instead of juggling emails and spreadsheets, project managers can view the entire bidding pipeline in one place – from invitations to signed contracts. Additionally, it automates the process of turning successful bids into orders, cutting down on manual data entry and reducing errors. Like other dashboards, this tool simplifies operations by consolidating essential data into one actionable interface.
Key Metrics Tracked
The most effective dashboards monitor metrics across five key areas:
| Metric Category | Key KPIs | Why It Matters |
|---|---|---|
| Sales Performance | Win-loss ratio by salesperson; won bids by lead source | Highlights top performers and effective channels |
| Financial Accuracy | Profit variance (bid vs. actual) by estimator | Enhances cost estimation accuracy for future bids |
| Pipeline Health | Pending bid amount; probability of win; bids due/expiring | Helps forecast workload and prevents missed deadlines |
| Client Engagement | Proposal email open/click rates; vendor intent to bid | Measures interest and prioritizes follow-ups |
| Market Trends | Predicted pipeline; top project types by value | Aligns bidding strategies with emerging opportunities |
One standout metric is profit variance by estimator, which compares bid estimates to actual project costs. This data uncovers patterns of under-pricing specific project types, which can significantly impact profit margins over time.
Best Fit for Construction Teams
This dashboard is ideal for estimators, project managers, and business development leads handling multiple bids at once. It’s also a valuable tool for business owners seeking a high-level overview of their company’s pipeline and win rates without diving into individual files.
Contractor Foreman integrates bid management with its broader suite of construction tools, ensuring estimates, proposals, and project execution are seamlessly linked. It allows users to compare vendor submissions side-by-side and provides a sales funnel view to track opportunities before they become active projects. As Contractor Foreman explains:
“We make it easy to see the submissions from each bidder side-by-side. We make it easy for your Subs and Vendors to use.” – Contractor Foreman
With pricing starting at $49/month, it offers a structured solution for bid management that’s straightforward to use.
Visualization Features
The best dashboards rely on Kanban-style boards to organize bids by status – Open, Submitted, Won, or Lost – so bottlenecks can be spotted instantly. Notifications for proposal email opens ensure timely follow-ups.
For teams comparing multiple subcontractors, side-by-side bid leveling is a game-changer. This feature presents itemized cost breakdowns from each vendor in a clear, tabular format, making it easier to identify scope discrepancies. Some platforms are even incorporating AI-driven forecasting. For example, one system flagged a predicted 24% rise in residential permits and recommended locking in lumber prices and securing additional concrete suppliers ahead of demand. Insights like these transform the bidding process from reactive to proactive, giving teams a competitive edge.
8. Predictive Analytics Dashboard
Primary Use Case
The Predictive Analytics Dashboard takes project management to the next level by forecasting potential problems before they happen, giving managers the chance to act early. Unlike standard dashboards that focus on past performance, this tool leverages leading indicators to predict future challenges.
For example, instead of waiting to react to budget overruns or missed deadlines, the dashboard sends out early warnings – sometimes as much as 45 days in advance. This proactive approach can significantly reduce budget deviations, cutting them from 30% to less than 8%. It’s not just about small gains; it’s a whole new way of managing projects.
Key Metrics Tracked
Predictive dashboards focus on four main areas, each with specific metrics that help teams stay on top of their projects:
| Category | Key Metrics | What They Tell You |
|---|---|---|
| Schedule | Predicted finish date, schedule integrity score, compression risk | Whether the current plan is realistic and when the project is likely to finish |
| Financial | Forecast Cost to Complete (FCTC), margin fade/gain, budget variance | How the final budget is shaping up and whether profits are holding steady |
| Labor & Production | Labor hour burn curves, actual vs. budgeted hours, production rates | If crews are on track or at risk of going over budget |
| Risk | Risk probability scores, safety risk scores, variance alerts | Which risks are most likely to occur and when |
One standout metric is margin fade/gain, which provides a constant view of profit trends. Spotting a margin fade early gives teams a chance to adjust – whether by tightening the scope, renegotiating terms, or reallocating resources – before profits take a hit.
Best Fit for Construction Teams
Predictive dashboards are particularly useful for mid-to-large EPC firms and civil contractors dealing with fluctuating resources. That said, even smaller contractors are finding value in these tools, as they help identify profit leaks and pinpoint at-risk projects early on.
A great example comes from Manhattan Construction Group. They used SmartPM‘s predictive analytics to analyze schedule data on an ongoing project. At the halfway point, the software predicted a finish date that was accurate to within a single day of the actual completion. This level of precision can help project managers feel confident when discussing timelines with stakeholders.
Visualization Features
Visualization tools like resource heatmaps, S-curve cost charts, and portfolio health views make it easier to understand complex data. These tools offer quick insights into labor density, spending patterns, and project risks. Drill-down grids are another handy feature, allowing users to dive into detailed project data without jumping between screens.
Contractor Foreman enhances these capabilities by integrating real-time financial and field data, combining daily logs, labor hours, and cost information into a single platform. This ensures that your forecasts are always based on up-to-date numbers.
These predictive tools round out the suite of BI dashboards, providing a proactive edge that complements the integrated systems discussed earlier.
Comparison Table
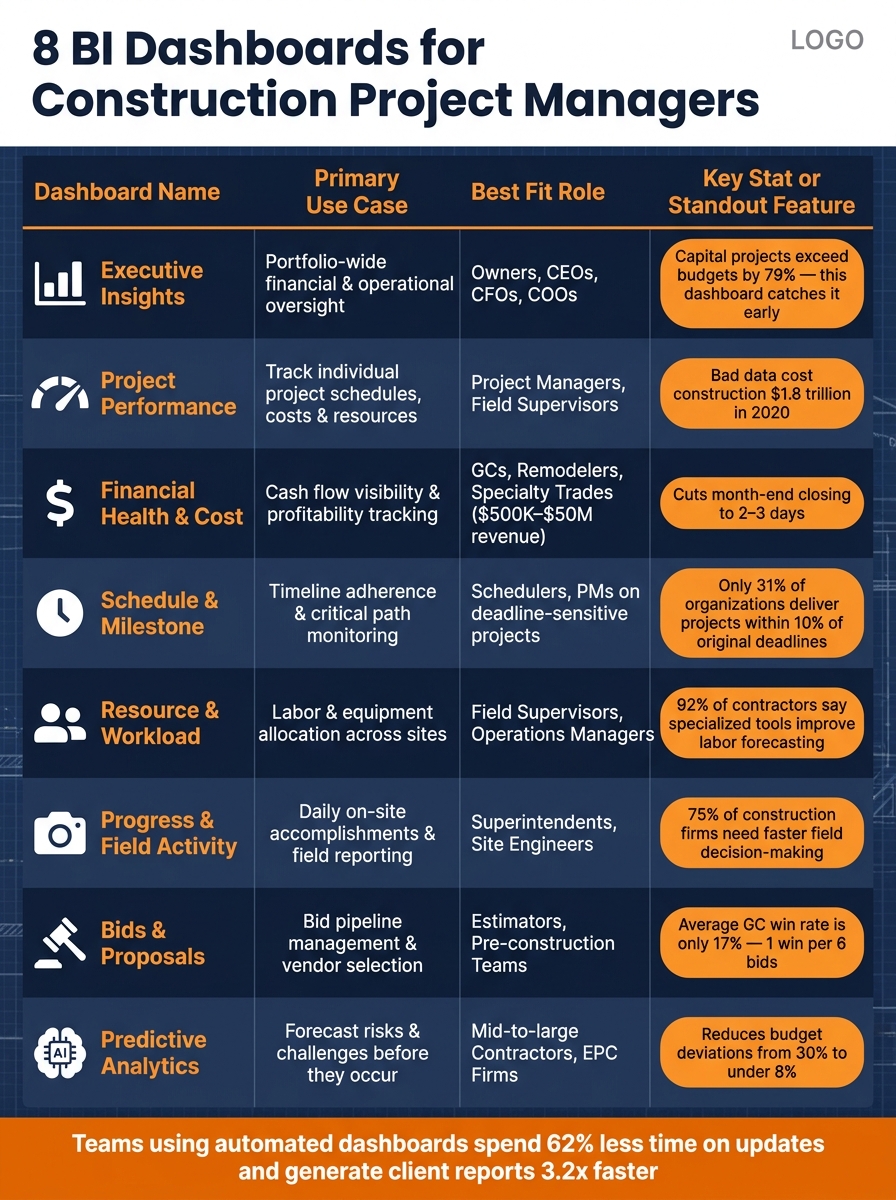
8 BI Dashboards for Construction Project Managers: At-a-Glance Comparison
Choosing the right dashboard can make all the difference in managing projects effectively.
Each dashboard is designed for a specific purpose, catering to different roles, project sizes, and challenges. The table below provides a side-by-side comparison of eight dashboards, helping you quickly identify which one aligns with your project’s needs.
Teams using automated dashboards have reported impressive results, such as spending 62% less time on updates and generating client reports 3.2 times faster. These kinds of time and efficiency savings are achievable only when you’re working with the right tool for the job.
| Dashboard | Primary Use Case | Key Metrics | Best Fit | Visualization Features |
|---|---|---|---|---|
| Executive Insights | Portfolio oversight | Portfolio P&L, budget vs. actual, progress curves | Owners, C-suite, investors | Multi-project summaries with KPI cards |
| Project Performance | Identifying at-risk projects early | Project Health Index™, SPI, percent complete vs. planned | Project managers on active jobs | Health gauges, color-coded grades, trend lines |
| Financial Health & Cost | Budget control and cash flow visibility | Burn rate, construction change order value, retainage, balance to finish | PMs and finance leads | Variance charts, cost breakdown panels, payment progress curves |
| Schedule & Milestone | Timeline adherence and critical path monitoring | Critical path delay, float trends, milestone variance | Schedulers and PMs on deadline-sensitive projects | Gantt-style timelines, S-curves, milestone trackers |
| Resource & Workload | Labor and subcontractor management | Team utilization, GPS-verified attendance, hours logged | Field supervisors and operations managers | GPS maps, team rosters, execution bars |
| Progress & Field Activity | Daily site operations and quality control | Inspection completion rates, RFI status, snag lists | Field teams and site engineers | Photo logs, submittal pipelines, status breakdown charts |
| Bids & Proposals | Pre-construction estimating and vendor selection | Win rate, takeoff accuracy, subcontractor performance ratings | Estimators and pre-construction teams | Linked estimate workspaces, contractor scorecards |
| Predictive Analytics | Proactive risk mitigation and forecasting | Predicted completion date, margin fade/gain, scope creep signals | Mid-to-large contractors and EPC firms | AI risk alerts, forecast engines, resource heatmaps |
This comparison highlights how the right dashboard can transform project management. For example, combining Predictive Analytics with Financial Health & Cost dashboards provides both early risk warnings and clearer cost insights across your portfolio.
Conclusion
The right BI dashboard can completely change how project management works. By combining field activity, budgets, and schedules into one centralized view, teams can shift their focus from reacting to issues to actively preventing them. Companies that use construction-specific BI tools are five times more likely to make faster decisions and twice as likely to achieve top-tier financial performance.
To recap: each dashboard is designed for a specific purpose. The best way to start is by identifying your most pressing challenge – whether it’s cost overruns, delays, or resource allocation issues – and then selecting the dashboard that directly addresses that need.
Equally important is integration. A dashboard that connects seamlessly with your construction accounting software, scheduling tools, and field apps eliminates the need for manual data entry. This ensures that all teams have access to consistent, real-time information.
For those managing projects across multiple teams, Contractor Foreman offers a robust solution. For just $49/month, it provides integrated project management, financial tracking, scheduling, and field reporting. With over 35 built-in features and integrations with platforms like QuickBooks and Zapier, it’s designed to grow with your needs.
“Contractor Foreman is more intuitively understandable to me and our type of business. They use the same terminology as we do.” – Brian T., Tower Interiors Group LLC
The key to a successful BI strategy lies in aligning the dashboard with your workflow. Start with one dashboard, get comfortable with it, and expand your approach as your reporting needs evolve.
FAQs
Which BI dashboard should I start with first?
Kick things off with a high-level financial dashboard to get a clear picture of your company’s overall financial health. This tool lets you monitor key metrics like job costs, profitability, and cash flow at a glance.
Once you’re familiar with the broader view, you can dig deeper. Use custom reporting tools to analyze project-specific details, such as time card data or resource planning. With Contractor Foreman, this process becomes much easier. It delivers real-time, actionable insights, cutting down on the hassle of manual data tracking.
What tools should my BI dashboard integrate with?
When designing a BI dashboard for construction projects, it’s crucial to incorporate tools that bring together financial, scheduling, and operational data in one place. This eliminates the need for manual data entry and ensures you have access to real-time insights.
One standout tool is Contractor Foreman, which integrates with over 50 systems. This connectivity allows for seamless data flow and a comprehensive view of your project’s performance.
Here are some key integrations to consider:
- Financial tools: Platforms like QuickBooks Online, Stripe, Gusto, and SweetPay help manage budgets, payroll, and payments efficiently.
- Scheduling and operations: Tools such as Google Calendar, Outlook Calendar, CompanyCam, and MS Project keep everyone on track and aligned.
- Automation: Solutions like Zapier and Kreo Takeoff streamline repetitive tasks, saving time and reducing errors.
By leveraging these integrations, your BI dashboard can become a powerful resource for managing construction projects effectively.
How do I keep dashboard data accurate in real time?
To keep things accurate in real time, ditch manual spreadsheets and switch to a centralized platform like Contractor Foreman. This approach consolidates budgets, labor, and schedules into one reliable source.
Pair it with tools like QuickBooks for instant financial updates, and streamline field data collection with digital logs and GPS-enabled timecards. Implement role-based access and audit logs to manage who can make changes and to track updates, ensuring your data stays reliable and secure.