You’re three weeks behind schedule.
Nobody’s tracking it that closely — the schedule updates are more “vibes” than actual data, and nobody’s touched the risk register since the kickoff meeting. Nobody’s panicking, because well…on paper, you’re still within budget.
Paul, the builder, shrugs and gives you a pep talk: “We’ve done this before, we can do it again.”
Allan, the site supervisor, agrees: “It’s fine, don’t worry too much. We’ll make it up on the back end.”
But in the end?
Nobody made it up on the back end.
The delay turned into $80K in overtime, rentals, and extended overhead — the exact kind of cost nobody saw coming because nobody was tracking it right.
That’s what QCRA and QSRA are built to catch— together.
QCRA (Quantitative Cost Risk Analysis) takes your cost estimate and tests it against everything that could push the price up — bad weather, material delays, a sub that underbid the job. Instead of handing you one confident number, it runs the numbers thousands of times and gives you a range: what you’ll probably pay, and what you’ll pay if a few things go wrong at once.
QSRA (Quantitative Schedule Risk Analysis) does the same thing, but for your schedule instead of your budget. It takes your project timeline — every task and how they depend on each other — and runs it through the same kind of stress test. Instead of one hopeful finish date, you get a range: when you’ll probably wrap up, and when you’ll actually wrap up if the permit office drags its feet and the crew falls behind on two activities at once.
Run them separately, and you only ever see half the risk. Run them together, and you’d have seen Allan’s “back end” plan falling apart three weeks before it actually did.
KEY POINTS:
- QCRA starts with a cost estimate and shows a range of final cost outcomes in $
- QSRA starts with a logic-linked CPM schedule and shows a range of finish outcomes in days or dates
- Both can use Monte Carlo simulation, P50/P80/P95, S-curves, and tornado charts
- A delay often turns into added cost through field overhead, rentals, labor, and financing
- A P80 cost and a P80 schedule do not mean there is an 80% chance of hitting both at the same time
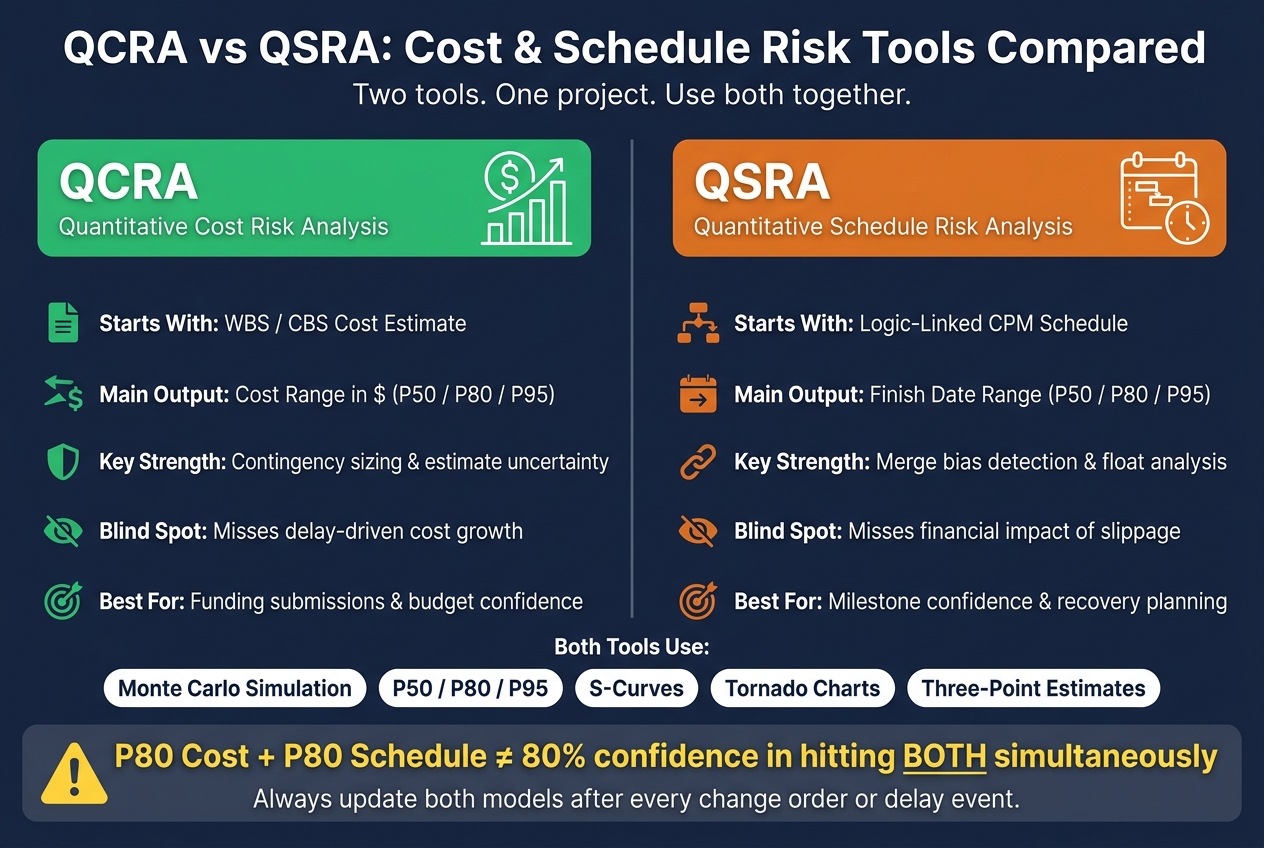
QCRA vs QSRA: Cost & Schedule Risk Tools Compared
Quick Comparison
| Tool | Starts With | Main Output | Best Use | Main Gap |
|---|---|---|---|---|
| QCRA | WBS/CBS cost estimate | Cost range in $ | Budget contingency, funding, forecast final cost | Misses delay-driven cost if schedule is not tied in |
| QSRA | Logic-linked CPM schedule | Finish range in dates/time | Milestone confidence, float, recovery planning | Misses the dollar hit from slippage |
What stands out most to me is the link between the two.
As they say “Time is money, money is time.”
Time loss often becomes cost growth. So the smart move is simple: use QSRA to see finish-date risk, QCRA to size budget contingency, and review both together after each approved change.
sbb-itb-5eea312
1. Cost Risk Analysis Tools
A Quantitative Cost Risk Analysis (QCRA) tool begins with a base cost estimate, usually laid out in a Work Breakdown Structure (WBS) or Cost Breakdown Structure (CBS).
From there, it applies three-point estimates – optimistic, most likely, and pessimistic – to each line item, along with risk-register events that include both probability and dollar impact.
It also brings in time-driven costs like general conditions, site staff, equipment rentals, and financing costs, since those costs go up when a project takes longer. Put together, those inputs show the level of budget uncertainty tied to the job.
Model base-estimate uncertainty along with discrete risks, or the outcome range will be too narrow.
Once those inputs are in place, the model shows how much contingency the project needs.
The simulation produces a contingency forecast and percentile confidence levels such as P50, P80, and P95.
That gives contractors a way to compare the base estimate with a forecast final cost. For major programs, the U.S. Government Accountability Office recommends setting budgets at the 50th percentile or higher, with the 80th percentile as the preferred target.
One point matters more than it may seem: remove any contingency already built into line items before running the model. If contingency is already baked into the estimate, the model can double-count the buffer and make the result look safer than it is. After cleaning up the estimate, teams can run sensitivity analysis to test what changes when they add or remove specific risks and watch how the cost curve moves.
Cost risk results can also support or challenge delay claims. In plain terms, they help contractors measure how a delay or change order shifts the expected final cost.
2. Schedule Risk Analysis Tools
QSRA uses the same risk lens as cost analysis, but it turns uncertainty into finish-date risk.
A Quantitative Schedule Risk Analysis (QSRA) tool begins with a logic-linked CPM schedule, where each activity has proper predecessors and successors. If that network logic is missing, the model can’t push delays through the schedule. Hard date constraints create the same problem because they stop delay risk from moving through the network.
QSRA works with logic-linked activities, three-point duration estimates, project calendars, discrete risk events, and shared risks such as weather or permit delays. Those shared risks apply the same multipliers across all affected activities, which keeps related delays tied together.
Risk Outputs and Reports
Once the inputs are loaded, the model shows where schedule exposure piles up.
One of the most useful outputs is the correction for merge bias. When several schedule paths come together at one milestone, the odds of all of them finishing on time are lower than the odds of any single path finishing on time. Deterministic schedules miss this entirely.
Tornado charts then show which activities or risk drivers add the most variability to the finish date. That gives teams a clear view of where mitigation can make the biggest dent.
Decision Support for Contractors
Contractors use these outputs to compare mitigation options before they commit to a recovery plan. A team can model what happens if it adds crew, defers non-critical work, or resequences work, then check how the completion-date range shifts.
For change orders and RFIs, running a QSRA before approval helps put a number on the impact of proposed changes or delays and supports contingency requests. Those schedule results carry even more weight when paired with cost forecasts, because delay risk often becomes budget risk.
How Contractors Use Both Tools Together
Separate cost and schedule models only tell part of the story. One shows money. The other shows time.
Integrated analysis connects the two, so a delay in the field can be traced to the costs that grow with time.
Here’s how contractors keep both models in sync:
1. Set the Cost and Schedule Baselines
Start with a clean CPM schedule and a WBS-based estimate. Then split time-driven costs, like general conditions, field staff, and equipment rental, from fixed costs. That split matters because not every delay changes the budget in the same way.
2. Load the Risk Register and Quantify Uncertainty
Next, assign three-point estimates to activity durations and cost rates. Use shared risk drivers so linked problems stay linked in the model. If a risk can slow work and increase spending, both effects should move together instead of showing up as two unrelated issues.
3. Update Both Models After Each Change or Delay
Each change order, delay notice, or budget shift should trigger an update, and the schedule model should be updated first. Once the CPM logic is revised, rerun the simulation to see how the P80 completion date and P80 forecast final cost have moved.
The big rule here is simple: keep the schedule, estimate, and risk inputs aligned after every approved change. If one model moves and the others don’t, the output gets shaky fast.
4. Review Reports on a Regular Cycle
Most teams rerun the integrated model every month. In those reviews, they look at the P80 completion date, P80 forecast final cost, and critical path movement side by side.
That side-by-side view can flag trouble early. For example, if the P80 completion date keeps drifting later month after month while the deterministic schedule stays fixed, that’s a warning sign to step in before the delay becomes visible on site.
One Event, Two Impacts: A Reference Matrix
The matrix below shows how common field events feed into the next update step and the decision that follows.
| Event | Schedule Impact | Cost Impact | Update Sequence | Decision Point |
|---|---|---|---|---|
| Weather delay | Critical path shift; milestone pushed out | Higher general conditions, site staff, and equipment rental | 1. Update CPM logic; 2. Re-run QCSRA | Draw on schedule contingency or accelerate? |
| Scope change | New activities added to the logic network | Increased material quantities and direct labor hours | 1. Update WBS/budget; 2. Add activities to the schedule | Revise ETC or use cost contingency? |
| Permit holdup | Wait period added to dependent start dates | Prolongation costs for idle resources and equipment standby | 1. Update activity constraints; 2. Re-run simulation | Recover schedule or accept the new P80 date? |
| Labor shortage | Slower production rates; longer activity durations | Higher hourly rates (premium pay) or liquidated damages exposure | 1. Update 3-point duration estimates; 2. Update unit rates | Re-sequence work or revise the budget? |
Use schedule contingency for time overruns. Use cost contingency for the financial hit. And only use schedule compression when added resources can shorten the critical path in a real way.
These same differences show where each tool works best and where each one has limits.
Pros and Cons
Once the cost model and schedule model line up, the next step is simple: what decision is each one best at supporting? QCRA shows how much budget risk you have. QSRA shows how much delay risk you have. That difference matters most when contractors have to choose between budget protection and recovery planning. Trouble starts when a team leans on just one of those answers.
Where Cost Risk Tools Are Stronger
Use QCRA when you need a defensible contingency target for a funding submission or board approval.
Where Schedule Risk Tools Are Stronger
Use QSRA when milestone confidence, float, or recovery planning depends on how delays move through the network.
Limits of Using Only One Tool Type
A cost-only model relies on static cost lines. A schedule-only model leaves out the dollar effect of delay.
The gap is easier to see in the table below:
| Dimension | Cost Risk Tools (QCRA) | Schedule Risk Tools (QSRA) |
|---|---|---|
| Primary output | Cost S-curve (P50/P80/P95 in currency) | Date S-curve (P50/P80/P95 in dates) |
| Key strength | Estimate uncertainty and contingency sizing | Merge bias detection and float analysis |
| Major blind spot | Ignores time-driven cost growth from delays | Ignores financial impact of schedule slippage |
| Best fit | Funding submissions and budget confidence reporting | Milestone commitments and recovery planning |
One detail trips people up all the time: separate P80 cost and P80 schedule outputs do not equal an 80% chance of hitting both.
Conclusion
It comes down to one simple rule: QCRA sets the contingency budget. QSRA sets confidence in the completion date. You need both.
Why? Because when a project slips, the cost usually slips with it. Extra overhead, more labor hours, and inflation can all push the budget higher.
There’s another point that trips people up: a P80 cost target and a P80 schedule target do not mean the project is P80 safe on both at the same time.
For contractors, the practical move is pretty clear. Track both models side by side, and update them after every change order or delay event. Use QCRA to back up contingency. Use QSRA to back up the finish date. Then review both together so you can see the full picture.
FAQs
When should I use QCRA instead of QSRA?
Use QCRA when the main goal is to set a budget contingency or back up a defensible cost figure for funding submissions, board approvals, or contract talks.
QSRA is about completion dates and milestones. QCRA looks at budget lines and cost packages to show a range of final project costs. If delays are a direct cause of cost overruns, use an integrated analysis instead of treating them as separate tools.
Can one risk model cover cost and schedule?
Yes. A single risk model can cover both through Integrated Cost-Schedule Risk Analysis (QCSRA).
It ties the cost model to the resource-loaded schedule and runs a Monte Carlo simulation across both. That means you can see how schedule delays can trigger related cost overruns, like added labor or equipment rental costs.
The result is a more consistent, connected view of project risk.
How often should I update both risk models?
For major programs, update risk models quarterly after the initial model is built. The first build may take several weeks. After that, updates are usually much faster.
Sometimes, you’ll need to update the model sooner. That often happens when teams are closing out risks or getting ready for major milestones.
Keeping the model current turns risk analysis into a regular management habit. It also helps forecasts stay accurate as conditions change.