
- How to Prepare Your Data Sources Before Integration
- How to Connect QuickBooks for Financial Data
- How to Add Weather Data for Site Condition Tracking
- How to Bring Field Reports into Your Dashboard in Real Time
- How to Build and Maintain Effective Real-Time Dashboards
- Conclusion: Getting the Most Out of Real-Time Data
- FAQs
- Related Blog Posts
“Wait, what?! The painters are coming tomorrow?”
They shouldn’t be.
The flooring fell behind schedule on Tuesday. The superintendent knew. The project manager knew. The flooring crew definitely knew…so why is this happening?
Welp, the dashboard wasn’t updated, apparently.
So the painters showed up, eager and ready to work (god bless them!).
That’s the problem with outdated data and dashboards. And in construction, that can be pretty expensive. The tricky thing is that it usually isn’t discovered until somebody shows up at the wrong time, with the wrong materials, for the wrong job (in other words, when it’s too late).
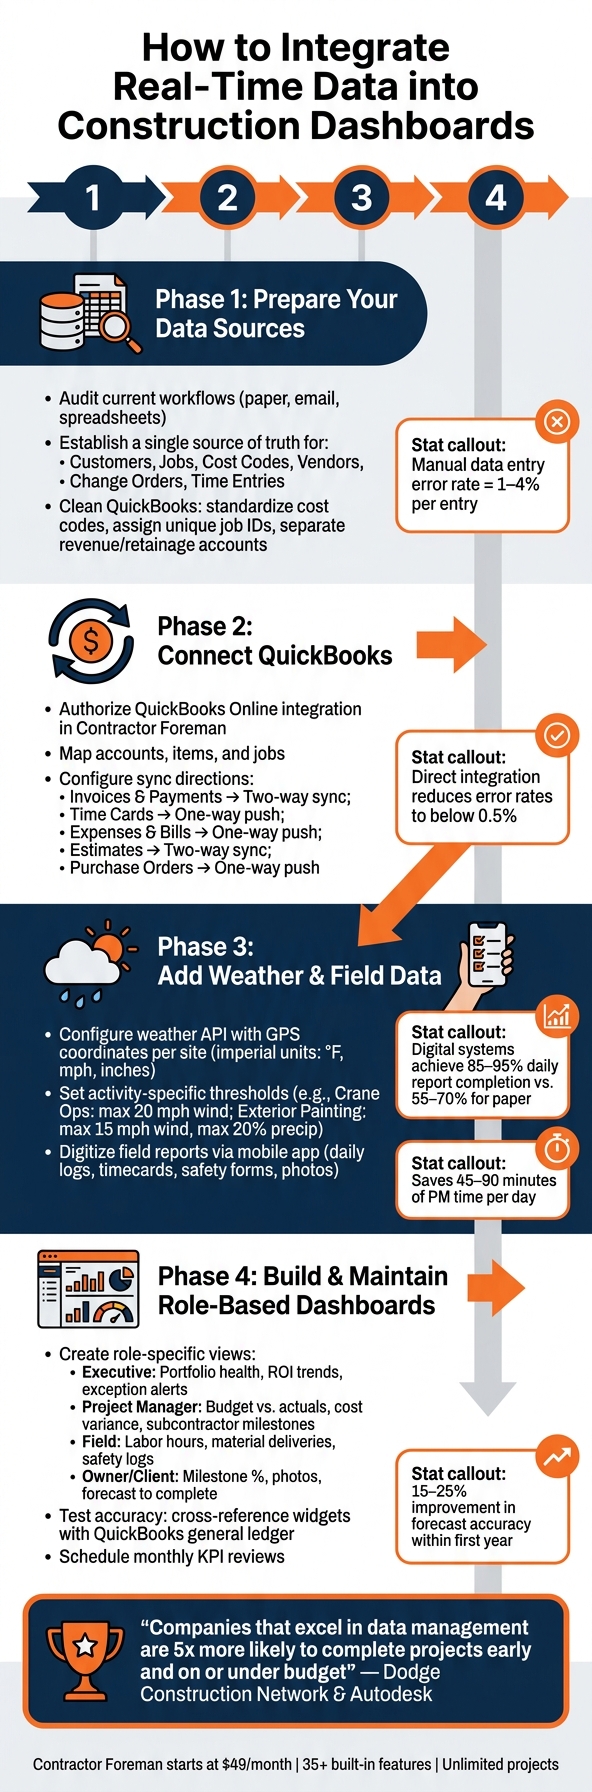
Make sure your team is working from the latest information with real-time data integration. By connecting financial systems like QuickBooks, weather APIs, and field reports to your construction dashboard, you can monitor costs, schedules, and site conditions as they happen.
No more “Didn’t we already discuss this?” or “What’s the latest?” conversations.
Here’s how to do data integrations right:
- Organizing data sources: Clean and standardize inputs like cost codes, job records, and time entries to prevent sync issues.
- Connecting QuickBooks: Sync financial data for real-time tracking of budgets, invoices, and labor costs.
- Adding weather data: Use site-specific weather APIs to monitor conditions affecting operations.
- Digitizing field reports: Replace paper logs with mobile time tracking apps for accurate, real-time reporting.
Platforms like Contractor Foreman simplify this process, offering integrations, automated syncing, and role-based dashboards starting at $49/month. With real-time insights, you can address issues faster, reduce costly delays, and keep projects on track.
How to Prepare Your Data Sources Before Integration
Before diving into connecting data sources to your dashboard, take the time to organize your data. Skipping this step is one of the most common – and expensive – errors contractors make. As integration expert Joseph Bryson aptly puts it:
“Integration amplifies whatever standards you already have – good or bad.”
Translation?
Automation won’t magically fix disorganized data. Instead, it will simply create a messier dashboard.
Auditing Your Current Data Workflows
Begin by mapping out where all your data currently resides.
Identify every location where labor hours, invoices, or site notes are recorded – whether it’s paper timecards, email threads, or spreadsheets. Then ask yourself: how often is the same data re-entered before it reaches your accounting system? Each instance of manual re-entry increases the likelihood of errors. Research shows that manual data entry has an average error rate of 1–4% per entry, which can quickly snowball on a busy project.
The key question to answer before moving forward is:
“If you can’t confidently answer ‘Where is the source of truth for jobs, cost codes, and SOV lines?’ you’re not ready to integrate.” – Joseph Bryson
To avoid confusion, designate a single source of truth for each critical data object, such as customers, jobs, cost codes, vendors, and change orders. Here’s a quick guide to help:
| Data Object | Recommended Source of Truth | Why It Matters |
|---|---|---|
| Customer / Owner | Accounting or CRM | Keeps billing records consistent |
| Job / Project | Accounting or PM System | Prevents duplicate project records |
| Cost Codes / Phases | Job Costing / Accounting | Ensures uniform formatting across systems |
| Vendor / Subcontractor | Accounting | Enables accurate payment and compliance tracking |
| Change Orders | PM / Billing System | Sync only at “Approved” status to protect totals |
| Time Entries | Field Mobile App | Feeds directly into labor costs and payroll |
Once you’ve established clear sources of truth, turn your attention to cleaning up your financial data in QuickBooks.
Preparing Financial Data in QuickBooks
After identifying where your data lives, focus on tidying up QuickBooks before integration.
Two common culprits behind sync errors are inconsistent cost codes and undefined accounts. Make sure your Chart of Accounts clearly separates revenue, receivables, and retainage. Standardize cost codes – for instance, use consistent formatting like dashes and leading zeros so “03-300” and “03300” are treated the same.
Additionally, assign unique IDs to job records instead of relying solely on names. Project names often change over time (e.g., “Oak Ridge Apts” might later appear as “OakRidge-2”), which can lead to duplicate entries and inaccurate reporting. Before going live, test your setup by manually processing a few pay applications and payments – this “First 10 Transactions” test helps catch configuration issues early.
Now, make sure external data sources like weather and field reports are equally ready for integration.
Setting Up Weather Data Inputs
When configuring your weather API, ensure all units align with U.S. standards: temperature in °F, wind speed in mph, and precipitation in inches. Use ZIP codes or GPS coordinates tied to each project’s exact address to ensure the data reflects real site conditions rather than a general area.
Decide how weather data will integrate with your project records. A smart setup links weather conditions directly to daily logs. For example, when a superintendent submits a field report, the system can automatically attach the day’s weather data. This creates a timestamped record that can be crucial if weather-related delays lead to disputes.
Structuring Field Reports for Digital Capture
Paper and email-based reports often see completion rates of just 55–70% daily, compared to 85–95% with digital systems.
This gap directly impacts the quality of your dashboard data. To improve accuracy, convert your daily logs and timecards into digital field reports with mandatory, standardized fields. These might include crew size, hours worked by trade, equipment used, materials received, and safety notes.
The goal is to create a single-entry system, where data is entered once at the source by the person who has it.
For instance, a superintendent can complete a digital daily log on their tablet at the end of each shift. This data then flows directly into your dashboard and accounting system, eliminating the need for manual re-entry. Setting up automated reminders – like an SMS alert to supervisors at 4:30 PM – can further boost completion rates to the 85–95% range. Companies using such systems often save 45–90 minutes of project manager time per day that would otherwise be spent chasing down reports.
sbb-itb-5eea312
How to Connect QuickBooks for Financial Data
Once your data sources are clean and organized, you’re ready to link QuickBooks to your construction dashboard. Contractor Foreman supports QuickBooks Online, but keep in mind that support for QuickBooks Desktop ended on January 1, 2026. If you’re still using the Desktop version, now’s the time to transition to Online for a smoother and more accurate integration process.
Setting Up the QuickBooks Integration
With your QuickBooks data cleaned and standardized, the next step is connecting your accounts. Navigate to the settings in Contractor Foreman and select the QuickBooks integration option. Use your QuickBooks credentials to authorize the connection. Once authenticated, map your QuickBooks accounts, items, and jobs to the corresponding fields in Contractor Foreman.
This mapping step is critical, as errors here can lead to mismatches. Take your time to ensure that income, expense, and retainage accounts are correctly assigned.
Configuring Data Sync Settings
After mapping, configure your sync settings. Decide on the sync direction and refresh rate. For invoices and payments, a two-way sync is usually the best choice, allowing updates to flow both ways. For time cards and expenses, a one-way push from Contractor Foreman to QuickBooks is generally more effective.
Here’s a quick breakdown of sync directions and their impact:
| Transaction Type | Sync Direction | Dashboard Impact |
|---|---|---|
| Invoices & Payments | Two-way | Real-time accounts receivable and cash position |
| Time Cards | One-way (push) | Labor cost variance and budget tracking |
| Expenses & Bills | One-way (push) | accurate job costing and committed costs |
| Estimates | Two-way | Baseline for margin analysis and cost variance |
| Purchase Orders | One-way (push) | Procurement status and upcoming liabilities |
The system includes built-in error handling to prevent duplicate records. Use the comparison tools within Contractor Foreman to verify the sync and ensure everything matches up.
Displaying Financial Metrics on Your Dashboard
Once your sync settings are active, your dashboard will immediately reflect the latest financial data. The Financial Dashboard highlights key metrics like job margin, cash position, labor costs, and cost variance. These figures update in real time as transactions sync from the field.
Need to track additional metrics? You can add custom fields to modules such as Estimates, Invoices, and Change Orders to monitor data points specific to your business needs.
To keep your dashboard accurate, regularly review your sync logs in Contractor Foreman. This helps you catch any issues early and ensures your financial data reflects the true state of your projects.
How to Add Weather Data for Site Condition Tracking
Now that your financial and field data are syncing without a hitch, it’s time to take things up a notch by adding real-time weather data to your dashboard. Weather conditions play a key role in construction planning and execution – whether it’s concrete pouring, crane operations, or exterior painting. Having accurate weather insights at your fingertips allows for smarter, on-the-spot decision-making.
Configuring a Weather API Integration
Start by choosing a weather service that aligns with your project’s needs. Accuracy is key here, so make sure to use your API key along with the precise latitude and longitude of the project site. Broad city-wide weather data often falls short, while hyperlocal data ensures more reliable insights. When setting up your API request, specify units=imperial for measurements like wind speed and temperature. Focus your data pull on critical metrics such as wind speed, temperature, and precipitation probability – these are essential for construction-related decisions.
Connecting Weather Data to Project Metrics
To make weather data actionable, link it directly to specific project activities. Set up automated alerts based on tailored thresholds for each task, rather than applying generic limits. For instance:
- Crane operations: Alert if wind gusts exceed 20 mph.
- Exterior painting: Pause work if wind speeds go over 15 mph or precipitation probability exceeds 20%.
Here’s a quick reference table for activity-specific weather thresholds:
| Activity | Max Wind (MPH) | Max Precip. Probability | Min Temp (°F) | Max Temp (°F) |
|---|---|---|---|---|
| Concrete Pour | 20 | 40% | 40 | 95 |
| Roofing | 25 | 30% | 35 | 100 |
| Crane Operations | 20 | 30% | 15 | 105 |
| Exterior Painting | 15 | 20% | 50 | 95 |
| General Outdoor | 25 | 50% | 32 | 100 |
Automate the process further by configuring webhooks to attach current weather conditions to daily logs as soon as field reports are synced.
Mark these weather fields as read-only to prevent manual edits, safeguarding the accuracy of records for potential delay claims or insurance purposes. Use alerts triggered by these thresholds to feed directly into your dashboard for real-time visibility.
Using Dashboard Widgets to Display Weather Data
In platforms like Contractor Foreman, you can integrate weather data directly into daily log entries.
This ensures that key weather metrics are always visible alongside other project information. A centralized risk monitor with color-coded indicators can provide real-time safety and productivity alerts across all your sites.
For optimal performance, configure widgets to pull weather data using the exact GPS coordinates of each site. Set the API to poll regularly throughout the day, ensuring you capture any forecast changes before shifts start or work begins. This approach keeps your dashboard up to date while staying within API usage limits. By combining weather insights with financial data and field reports, you’ll have a unified, real-time view of your project’s status.
How to Bring Field Reports into Your Dashboard in Real Time
Adding real-time field reporting to your dashboard complements financial and weather data integration, giving you a complete picture of your projects. Daily logs, top construction timesheet software, daily logs, and safety reports provide crucial insights, transforming raw activity into actionable data.
Collecting Field Data on Mobile Devices
To gather data directly from the job site, foremen and crew members can use the Contractor Foreman mobile app to submit daily logs, timecards, safety forms, and photos. These submissions, made on standardized digital forms, ensure consistent and accurate data across all crews.
Features like automatic timestamps and GPS tracking, including geofencing, verify that submissions come from the actual job location. By using drop-down fields for trades, cost codes, and project phases instead of free-text entries, you can standardize data entry further. Contractor Foreman also provides over 50 ready-made forms and a custom form builder to meet your specific needs.
Once the data is collected, the next step is syncing it seamlessly with your dashboard.
Syncing Field Reports to Your Dashboard
When a foreman submits a daily log or timecard, the data syncs automatically with the project record, appearing on your dashboard without requiring manual re-entry. For areas with poor connectivity, the app saves entries offline and uploads them once a connection is re-established, ensuring no jobsite is left out of view.
Daily log records can even be generated directly from timecards, saving time and eliminating duplicate data entry. This ensures that labor hours in the logs match the actual time clocked, and incident reports can be cross-referenced with daily logs for accuracy.
“The time tracking software for my crew allows me to keep track off all my guys hours and where they are and what they are doing. This helps on jobs where I can cross reference their productivity on linear foot of wall and square foot of wall completed per hour.” – Matthew S., M. Smith Contracting
To maintain accurate and timely data, consider setting a daily cut-off time for submissions – such as 5:00 PM local time.
This ensures your dashboard reflects the full day’s performance by evening, ready for review the next morning.
This efficient syncing process sets the stage for creating personalized dashboard views.
Customizing How Field Data Appears in Your Dashboard
Different stakeholders need different views of the data.
For example:
- Superintendents may focus on daily production and unresolved safety items.
- Project managers might compare labor hours against budgets by cost code.
- Executives may require a portfolio-wide view of overtime trends.
Persistent filters let users customize their views by trade, crew, project phase, cost code, or date range, and these filters remain active as you navigate between different dashboard sections.
For additional flexibility, custom fields can address unique needs. For instance, adding a “Work Area” field (e.g., Level 3, East Wing) allows you to track productivity in specific building sections or monitor safety performance for a particular client work order. The drag-and-drop custom report builder makes it easy to arrange columns and metrics without needing IT support.
With live mobile data feeding into the system, every stakeholder can access up-to-date information, eliminating reporting delays and ensuring everyone stays informed.
How to Build and Maintain Effective Real-Time Dashboards
Building Dashboards by User Role
Creating dashboards tailored to specific roles ensures that users see only the information relevant to their responsibilities. This way, each person gets the insights they need without unnecessary clutter.
| Role | Primary Focus | Key Metrics |
|---|---|---|
| Executive | Portfolio health | Exception alerts, ROI trends, resource utilization |
| Project Manager | Variance & risk | Budget vs. actuals, subcontractor milestones, cost/schedule performance |
| Field | Daily production | Labor hours, material deliveries, safety logs, site conditions |
| Owner/Client | Transparency | Milestone completion %, photo documentation, forecast to complete |
For field staff, dashboards should be mobile-friendly, allowing quick access to essential data on a smartphone during busy workdays. On the other hand, executive dashboards should highlight trends and exceptions rather than overwhelming users with raw data. Tools like Contractor Foreman provide role-based access controls to ensure sensitive financial data is accessible only to the right users.
Once the role-specific views are designed, it’s critical to test integrations thoroughly. This ensures that the data displayed is accurate and reliable before the dashboards are fully deployed.
Testing and Checking Data Accuracy
After tailoring dashboards for different roles, the next step is to verify the accuracy of every metric by cross-referencing it with its original source. For instance, compare the budget vs. actuals widget in your dashboard with the general ledger in QuickBooks. Similarly, confirm that timecard entries align with labor cost totals. This step helps identify and resolve mapping errors early in the process.
Direct integration of field data with accounting systems can significantly reduce error rates, often bringing them below 0.5%. To further enhance accuracy, establish validation rules at the data entry point. For example, require a cost code on every timecard to prevent errors from entering the system. Additionally, configure automated alerts to flag major deviations, such as when a cost variance exceeds 5% of the project budget. These proactive measures help address issues immediately rather than discovering them during month-end reviews.
Keeping Your Dashboards Up to Date
Real-time dashboards require regular maintenance to remain effective. Updates to source systems like QuickBooks – such as changes to data structures or field names – can disrupt integrations, often without triggering visible error messages.
“Real-time reporting is not set-and-forget. Review your KPI dashboard monthly to assess whether the metrics you’re tracking are actually driving better decisions. Add or remove data fields as project phases change.” – FieldPie
To keep dashboards relevant, schedule monthly reviews to ensure data syncing remains intact and KPIs reflect current priorities. Remove outdated widgets and adjust metrics as project phases evolve. These updates can result in a 15–25% improvement in forecast accuracy within the first year. By maintaining these practices in tools like Contractor Foreman, you can ensure your dashboards stay aligned with operational goals and remain a dependable resource for real-time decision-making.
Conclusion: Getting the Most Out of Real-Time Data
Once your data sources are aligned and workflows are synced, the next step is making the most of unified, real-time insights. Contractor Foreman simplifies this by integrating QuickBooks, weather APIs, and field reports, eliminating disjointed processes. The result? A live, consolidated view of your project’s finances, site conditions, and schedules – all in one place.
With QuickBooks integration, you can track budget versus actuals instantly. Weather feeds provide crucial updates for on-site decisions, while field reports ensure seamless communication between the field and the office – often in minutes, not hours.
Research from Dodge Construction Network and Autodesk highlights the advantage of effective data use. Companies that excel in data management are 5 times more likely to complete projects early and on or under budget compared to those relying on outdated manual methods. This competitive edge comes from the ability to quickly identify and address issues – precisely what a real-time dashboard like Contractor Foreman delivers.
Contractor Foreman, one of the top construction technology apps, combines over 35 built-in features with tools like direct QuickBooks sync, mobile field reporting, and role-based dashboards. And it does all this without the need for custom development or a hefty enterprise budget. Starting at just $49/month, Contractor Foreman supports unlimited projects and includes free training and support. This means your team can create dashboards that not only work for today but evolve as your business grows.
FAQs
What data should be my single source of truth before syncing?
Your go-to source for all project-related information should be a centralized construction management platform, such as Contractor Foreman.
This type of platform ensures all your project data is stored, standardized, and updated in real time.
To get started, organize your records by standardizing naming conventions and cost codes. When you’re ready to sync, take advantage of features like Link Records to merge existing contacts and projects seamlessly. Also, double-check that items like estimates and invoices are marked as Approved or Verified – this helps prevent duplicate entries.
How often should my dashboard sync with QuickBooks Online?
Contractor Foreman’s integration with QuickBooks Online works both ways, meaning your dashboard stays aligned with your financial data in real time. Automatic background syncing ensures that invoices, expenses, and job costs are always current, cutting down on manual updates. If you prefer, you can adjust the sync intervals to fit your business operations, giving you accurate financial reports without any lag or extra hassle.
What’s the best way to tie weather data to daily logs automatically?
To simplify tracking weather data in daily logs, you can rely on construction management software equipped with API or webhook integrations.
By linking this software to a weather service API, you can automatically fill in key metrics like temperature, wind speed, and precipitation directly into your log templates. This approach not only ensures consistent and precise records – essential for analyzing delays or processing change orders – but also saves field teams from the hassle of manual data entry.
Related Blog Posts
- How Dashboards Simplify Budget vs Actual Cost Tracking
- Best Practices for Construction Data Analytics Integration
- How Dashboards Help Track Construction KPIs in Real Time
- How Dashboards Improve Contractor Productivity