If you’ve ever wished you could clone yourself — just for a short while, just enough to have one version of you answering emails while another is on a job site and a third is somehow doing the invoicing — congratulations, you’re definitely a contractor!
The dream isn’t work-life balance. The dream is three of you and a perpetually-churning shared calendar. But since science hasn’t caught up to your ambition yet, being truly productive would basically require working 150 hours a week, which, great news, is technically possible once you’ve figured out how to stay alive with zero sleep.
Enter: the construction dashboard.
Not exactly a clone or a cure for your 47 unread emails. But the closest thing to having everything — your projects, your timelines, your costs, your team — in one place.
What’s great about good construction dashboards is that they simplify construction project management by consolidating data into a single, real-time view. That way, your brain isn’t the only thing holding it all together.
This helps contractors track progress and control costs more efficiently.
Here’s how dashboards significantly boost productivity:
- Real-Time Insights: Dashboards provide up-to-date data on schedules, budgets, and resources, enabling faster decisions.
- Error Reduction: Automated data entry minimizes mistakes, preventing costly rework (which accounts for 14% of global construction costs).
- Key Metrics: Track essential KPIs like Schedule Performance Index (SPI), labor utilization, and job cost variance to maintain profitability.
- Workflow Integration: Dashboards connect with tools like QuickBooks, syncing data and saving time on administrative tasks.
- Mobile Access: Field teams can log updates instantly, improving communication and reducing delays.
Key KPIs Contractors Should Track Using Dashboards
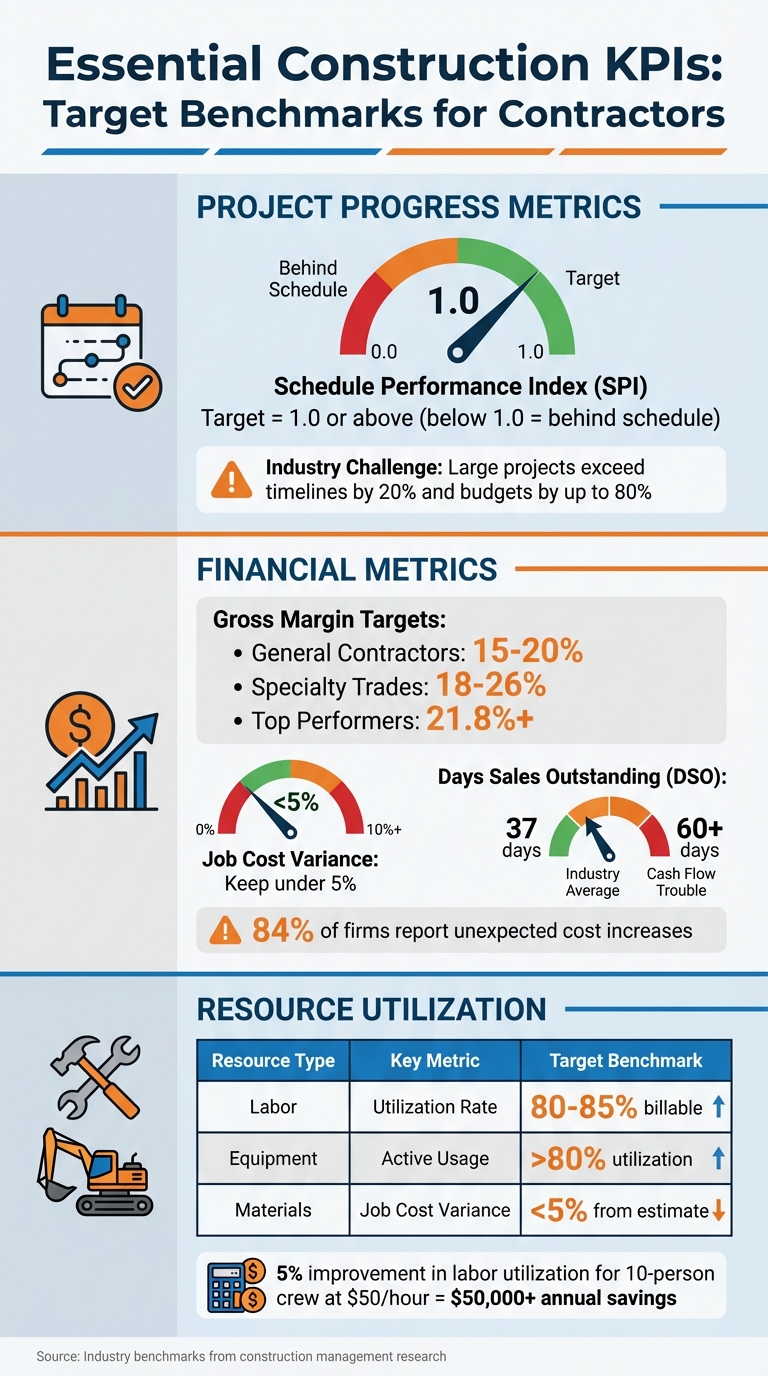
Key Construction KPIs and Target Benchmarks for Contractors
Not every metric deserves the same level of attention. The right KPIs transform raw data into actionable insights, helping contractors keep projects on time and within budget. Let’s break down the key areas to watch.
Project Progress and Timeline Tracking
One essential metric is the Schedule Performance Index (SPI), which compares completed work to what was planned. An SPI below 1.0 means you’re behind schedule. This matters because large projects often exceed timelines by 20% and budgets by up to 80%. Weekly SPI tracking can catch delays early, preventing minor issues from growing into costly problems.
Other timeline metrics to monitor include milestone completion rates and look-ahead schedules (covering the next 2–4 weeks). These help field teams anticipate material needs, equipment, and tasks. High change order frequency is another red flag, often pointing to poor planning that can throw off schedules.
For example, BuildCore Group used SPI dashboards to complete a $2M office project two weeks early and 5% under budget.
“If you’re not tracking KPIs, you’re not managing projects – you’re guessing.”- Lipsa Pati, OConstruction
By displaying SPI and related metrics on dashboards, contractors can spot and address delays quickly, integrating these insights seamlessly into their workflows.
Budget and Financial Metrics
Financial transparency is critical to avoid “silent margin erosion”, where profits shrink due to rework, waste, or delays. General contractors should aim for a gross margin of 15–20%, while specialty trades often target 18–26%. Top performers can achieve margins of 21.8% or more.
Key metrics include job cost variance, which should stay under 5%, and Days Sales Outstanding (DSO). The industry average DSO is 37 days, but exceeding 60 days could signal cash flow trouble. With 84% of firms reporting unexpected cost increases, and nearly half of contractor failures linked to poor cost control, these metrics are critical.
“Your bank balance is a snapshot of one moment in time that tells you almost nothing useful. You could have $200K in the bank and be three months from insolvency because you’re sitting on unprofitable contracts.”- UpstreamCFO
Dashboards that offer real-time financial updates help contractors catch and address cost overruns before they eat into profits.
Resource Allocation and Utilization
Effective resource management starts with tracking your labor utilization rate, which measures billable hours against total hours worked. The target? 80–85% billable time. Falling below 75% often signals wasted time. A small boost – just 5% – in labor utilization for a 10-person crew earning $50/hour can save over $50,000 annually.
For equipment, aim for utilization rates above 80%, ensuring costly machinery isn’t sitting idle. Additionally, monitor material cost variance by comparing actual usage to estimates. This helps identify waste or unexpected cost spikes early. Many contractors also track daily hours against installed quantities to pinpoint inefficiencies.
| Resource Type | Key Metric | Target Benchmark |
|---|---|---|
| Labor | Utilization Rate | 80–85% billable |
| Equipment | Active Usage | >80% utilization |
| Materials | Job Cost Variance | <5% from estimate |
Tracking these metrics ensures resources are used efficiently and feeds real-time data into dashboards for better decision-making.
sbb-itb-5eea312
How Dashboards Streamline Workflows
Dashboards bring data together and automate repetitive tasks, allowing teams to concentrate on managing projects instead of chasing information.
Centralizing Data for Better Team Collaboration
Data silos are a major obstacle to productivity, especially on construction sites. When project plans are stored in one system, RFIs in another, and daily logs on paper, teams waste valuable time hunting for information. Dashboards solve this by providing a single source of truth, where both field crews and office staff access the same real-time data.
With mobile tools, field teams can quickly submit photos, reports, and GPS-verified time cards, giving project managers instant visibility no matter where they are. This is critical because 30% of project time is typically lost due to poor coordination, and delays can cost between $500 and $2,000 per day in overtime and missed opportunities.
Dashboards also replace scattered communication methods, like text threads and paper logs, with structured, centralized channels. This ensures everyone sees updates in real time, reducing miscommunication. Contractors can even recover up to 8% in costs by spotting and correcting time entry errors within days rather than weeks using digital tools. This centralized approach not only improves communication but also lays the groundwork for automated reporting.
Automating Reports and Updates
Manual reporting takes up time that could be better spent managing projects. Dashboards simplify this by automating report generation and delivering updates directly to stakeholders. Instead of compiling spreadsheets or drafting progress emails, contractors can set up automated reports or grant clients read-only access to a dedicated portal.
Automating these processes also reduces errors by removing manual data entry. For example, HITT Contracting adopted real-time dashboards under Karl Sorensen, their Director of Project Solutions. These dashboards provided stakeholders with on-demand data, enabling project managers to address potential schedule and budget issues early.
“We gather data and metrics in real-time or near real-time to create a reporting structure that is a feedback loop to our project managers and our business unit leaders.”-Karl Sorensen, Director of Project Solutions, HITT Contracting
Digital templates for RFIs, safety reports, and change orders further streamline workflows, ensuring consistent data entry across teams. Supervisors can submit quick daily logs with photos through the dashboard, creating a searchable, automated record of progress without adding administrative burden. Beyond automation, connecting dashboards with other tools takes productivity to the next level.
Connecting Dashboards with Other Tools
Integrating dashboards with tools like QuickBooks and MS Project eliminates duplicate data entry and ensures reports are always up to date. This integration is a game-changer, as businesses that connect their scheduling and accounting systems save an average of 5-7 hours per week on administrative tasks.
Two-way syncing ensures any updates made in one tool are reflected in the other. For instance, when field teams log hours, that data flows directly into accounting software, reducing payroll processing errors by up to 40%. Small businesses adopting these solutions often see a 15-20% improvement in payroll accuracy.
| Integration Category | Compatible Tools | Workflow Benefit |
|---|---|---|
| Accounting | QuickBooks, Xero, Sage, FreshBooks | Automated timesheet transfers, real-time labor cost tracking, audit-ready records |
| Payroll | Gusto | Direct feed of attendance data eliminates manual entry |
| Scheduling | Setmore, Google Calendar, MS Project | 24/7 automated booking and sync with master schedules |
| General Automation | Zapier | Links dashboards with thousands of apps for custom workflows |
Contractor Foreman is a great example, integrating seamlessly with QuickBooks, Zapier, and other tools to create a smooth workflow from the field to the office.
These integrations help reduce the risk of labor law non-compliance by up to 70% and provide contractors with real-time insights into labor costs versus budgets, enabling quick staffing adjustments. By connecting these tools, teams save time and make better decisions, reinforcing the dashboard’s role in improving productivity.
Using Dashboards for Real-Time Monitoring and Better Decisions
Real-time dashboards are changing how contractors handle projects by replacing outdated methods with instant, actionable data. Instead of uncovering problems weeks later, teams can now identify and address issues as they arise, preventing small delays from spiraling into major setbacks.
Tracking Performance Metrics in Real Time
Construction moves quickly, and decisions need to keep up. In fact, 75% of construction firms stress the importance of fast decision-making on-site. With mobile tools enabling field crews to log hours or submit daily reports, project managers receive updates immediately – no more waiting for end-of-week summaries or manual data entry.
This immediate access to information reduces reliance on outdated data and helps avoid costly rework. Dashboards provide real-time insights into labor productivity, safety incidents, and task completion rates. This constant feedback loop ensures decision-makers can act swiftly to address issues.
Dashboards also help teams focus on what requires immediate attention. They highlight overdue RFIs, submittals nearing deadlines, and slipping critical path tasks. For example, since most contracts mandate submittals to be returned within 5 to 7 days, dashboards flag delays early, giving teams time to act before schedules are impacted. When paired with automated reporting, these tools allow teams to shift from reacting to problems to planning ahead.
Spotting Trends and Preventing Problems
Dashboards aren’t just about tracking the present; they also reveal patterns that signal potential future problems. For instance, if gross profit margins shrink across multiple projects or labor hours consistently fall short of plans, these trends alert contractors to issues that need attention.
Alex Six, Solution Specialist at Procore Technologies, explained:
“If submittals are falling behind and turnaround times are slipping, that’s one of the earliest signs productivity is at risk.”
Modern dashboards leverage predictive analytics to forecast when a project might exceed its budget or miss critical milestones. This advance notice allows contractors to adjust staffing, renegotiate with suppliers, or revise schedules before problems escalate.
They also enable cross-project benchmarking, allowing contractors to compare performance across jobs, regions, or project types. For example, if one site consistently excels in labor productivity or safety compliance, teams can analyze what’s working and apply those strategies elsewhere. By identifying trends like estimating errors or resource misallocations, dashboards offer insights that might otherwise go unnoticed.
Making Better Decisions with Data Visualization
Predictive insights are only as useful as their presentation, and visual data tools make complex information easy to grasp.
Charts, graphs, and color-coded indicators turn raw data into actionable insights. For example, a traffic light system (green for on track, yellow for caution, red for at risk) gives managers a quick snapshot of project health without having to sift through spreadsheets.
Gantt charts track timeline progress and highlight bottlenecks, while resource histograms show how labor and equipment are distributed, helping contractors prepare for demand spikes. Heat maps pinpoint high-risk areas on job sites, such as worker density or equipment placement, improving safety management. These visual tools unlock the potential of the 95% of construction data that often goes unused.
Alex Six emphasized the role of dashboards as tools to support, not replace, project management:
“Dashboards don’t replace project management – they inform it. The value isn’t in the data alone, but in what the team does with it: asking the right questions, spotting what doesn’t add up and acting before issues escalate.”
The effectiveness of these tools hinges on standardized data entry. Consistent use of cost codes, naming conventions, and reporting formats ensures dashboards generate accurate, reliable insights. Without this consistency, even the most advanced tools risk producing misleading conclusions, which can hurt productivity rather than help it.
Using Contractor Foreman Dashboards
Contractor Foreman takes the advantages of performance dashboards and rolls them into a single, streamlined platform. By applying proven dashboard strategies, this tool simplifies project management and improves decision-making. It centralizes essential tasks like financial tracking, project management, and resource monitoring into customizable views that contractors can access from anywhere – whether they’re at the office or out on the job site.
Contractor Foreman Dashboard Features
The Financial Dashboard offers a clear snapshot of key financial data, including Profit and Loss Statements, Accounts Payable, and Accounts Receivable. Users can dig deeper into metrics to compare budgeted expenses against actual costs, with figures displayed in standard U.S. currency (e.g., $1,234,567.89). This real-time insight helps contractors spot financial discrepancies early, preventing small issues from turning into costly overruns.
For project management, the platform includes tools like Gantt (CPM) scheduling, daily logs, and Work in Progress (WIP) reports to track project status. Kanban views organize tasks, estimates, and invoices into columns based on their current status, making it easy to see what needs attention at a glance. Time card reports ensure labor hours are accurately tracked by project, employee, and cost code. This data integrates directly into job costing, helping contractors verify payroll accuracy and measure productivity, such as hours worked versus hours scheduled (e.g., 80% utilization for a framing task).
Resource monitoring tools provide a quick view of labor, equipment, and material usage. The platform tracks quantities labeled “Delivered” versus “Billed”, helping manage shortages and maintain accuracy. With over 100 pre-built reports and a drag-and-drop custom report builder, contractors can create personalized KPIs. For example, they can track material costs in imperial units (e.g., 500 board feet at $2.50/ft) or monitor schedule adherence using MM/DD/YYYY date formats.
Benefits of Contractor Foreman Dashboards
One standout feature of Contractor Foreman is its mobile accessibility, which boosts productivity significantly. The app, available for iOS and Android, allows field crews to update dashboards on the go – logging progress, reporting issues, and accessing blueprints directly from job sites without delays caused by paperwork.
Chuck A. from Liercke Construction, LLC shared his experience:
“The integration of the whole platform is very good, including externally with QuickBooks Online. Ability to do time sheets in the field without separate software. Cost codes and cost items that can be used for different jobs, this is huge for us.”
The platform also integrates with QuickBooks and Zapier, automating data synchronization so contractors can focus on making decisions instead of handling repetitive administrative tasks. Features like GEO fencing ensure that clock-ins are restricted to designated job sites, guaranteeing that labor KPIs are accurate and location-verified.
Contractor Foreman offers unlimited free training and support, with an average response time of just 13 seconds and 95% of support chats rated five stars. This ensures contractors can quickly adopt the platform without facing steep learning curves. All plans support unlimited projects, starting at $49 per month for the Basic plan, and include a 30-day free trial and a 100-day money-back guarantee for annual subscriptions.
Getting Started with Contractor Foreman
To start reaping the benefits, sign up for Contractor Foreman’s 30-day free trial on the web platform. Once logged in, you’ll see an implementation notification on the dashboard – click through for onboarding guidance or contact the implementation team for personalized assistance. Free private training sessions (the number depends on your plan) and weekly group trainings are available to help your team get up to speed.
Set up unlimited projects and assign role-based access to control who can view or edit dashboard data. Customize widgets to focus on the KPIs most important to your business, such as budget tracking, project timelines, or resource usage. Use custom fields to track data specific to your operations, and switch to Kanban views for managing change orders and invoices efficiently.
During the initial setup, connect QuickBooks Online or Zapier to automate data syncing and eliminate duplicate entry. Download the mobile apps for real-time updates, and configure alerts for delays or budget thresholds. With these steps, you’ll gain instant access to real-time monitoring and actionable insights to keep your projects on track.
Conclusion
Summary of Dashboard Benefits
Performance dashboards replace outdated, manual methods with real-time, centralized data, giving contractors the ability to quickly identify profit, labor, or budget challenges. This is especially critical since 75% of firms require rapid decision-making in the field.
Inaccurate data can lead to costly rework – impacting 14% of projects and accounting for a staggering $88.69 billion in losses. Dashboards help prevent these issues by automating calculations and eliminating manual data entry, saving valuable time and reducing errors. Some firms have even reported recovering up to 8% in costs by catching mistakes early.
Dashboards go beyond financial management by improving team accountability and collaboration.
Role-specific views ensure that everyone – from executives to project managers to field crews – sees the metrics that matter most to their responsibilities. Whether it’s tracking labor utilization, work-in-progress updates, or daily progress, dashboards keep everyone on the same page. Plus, mobile accessibility lets teams update data directly from job sites, helping to eliminate coordination issues that consume roughly 30% of project time.
With benefits like these, adopting dashboards isn’t just an upgrade – it’s a game-changer.
Next Steps for Contractors
Take advantage of these dashboard benefits to transform your project management. Start your journey with Contractor Foreman’s 30-day free trial. With plans beginning at just $49 per month and dedicated support, the trial offers immediate value.
When implementing dashboards, focus on answering key business questions like, “Are we billing quickly enough to maintain cash flow?” or “Can we handle another large project bid?” by reviewing your construction estimating accuracy rather than simply displaying raw metrics. Set up a monthly review process with your leadership team to analyze trends, address anomalies, and take corrective actions. The most successful contractors aren’t just gathering data – they’re leveraging it to make smarter, faster decisions that drive profitability and long-term growth.
FAQs
Which KPIs should I track first in a contractor dashboard?
To get a clear picture of your business’s performance, start by keeping an eye on financial KPIs like profit margin, cash flow, revenue growth, ROI, and working capital. These metrics help you measure financial health and forecast profitability.
It’s also important to track project-specific KPIs, such as how well you’re sticking to schedules, the number of safety incidents, and the overall progress of your projects. Together, these indicators offer valuable insights into both financial performance and operational efficiency, enabling contractors to make smarter decisions and boost productivity.
How do I keep dashboard data accurate across field and office teams?
To keep your dashboard data accurate, focus on real-time updates and connect all your data sources. Implementing role-based access ensures team members only see the information relevant to their tasks, which helps minimize errors.
Make it a habit to sync data regularly from mobile apps, sensors, and digital forms into a centralized system. This ensures that everyone works with the most up-to-date information. Additionally, providing proper training on data entry and system usage is critical. It helps field and office teams maintain consistency and avoid discrepancies in the data.
What should I integrate with my dashboard to save the most time?
Integrating automated reporting tools and real-time data monitoring into your dashboard can be a game-changer for efficiency. Automated reporting takes care of tasks like tracking project progress, managing financials, and organizing safety documentation, cutting down on the need for manual input.
Meanwhile, real-time financial data monitoring gives you instant access to crucial KPIs, helping you make quicker decisions and keep costs in check. Together, these tools simplify workflows, handle repetitive tasks, and give contractors a noticeable productivity boost.