“Whoops! We’re over budget.”
Four words no contractor ever wants to hear — ever. Especially when they’re coming from a Tuesday morning phone call that could’ve been a Monday morning dashboard alert.
84% of contractors get blindsided by unexpected costs.
And nope, it’s almost never because material costs spike or the job went sideways overnight. That rarely happens.
Most of the time, budget overruns in construction happen so gradually you can’t even feel it. A few extra dollars for overtime here, another for a last-minute material swap there. No biggie. Until it very much is!
That’s exactly the gap construction management software dashboards are built to close.
Everything — QuickBooks, field logs, schedules, budgets — pulled into one place, updating itself in real time.
Budget burning faster than planned? FLAGGED!
Crew falling behind? FLAGGED!
Safety issue forming on site? FLAGGED!
That way, contractors stop finding out about problems after the damage is done — and start catching them while there’s still time to do something about it.
How dashboards help you stay on track:
- Centralized data: Combines multiple sources (e.g., QuickBooks, field logs) into one view.
- Real-time alerts: Flags budget overruns, delays, and safety issues immediately.
- Improved decision-making: Tracks critical metrics like Budget Variance, Schedule Performance Index, and Labor Productivity.
Problems with Tracking Construction KPIs Without Dashboards
Manual Data Collection Problems
You can’t fix it if you don’t know it’s happening.
Tracking data manually can lead to costly mistakes. For example, when field crews rely on paper timesheets, errors like illegible handwriting, rushed entries, or simple math mistakes can result in financial inaccuracies.
Consider this: with a 100-person crew earning $15 per hour, if just 16% of workers engage in 15 minutes of daily “buddy punching” (clocking in for someone else), the company could lose an estimated $62,400 each year. On top of that, office staff often spend hours chasing down missing timecards, fixing mistakes, and manually processing payroll – time that could be better spent on other priorities.
These manual processes not only waste time and money but also disrupt data consistency across teams, making it harder to track performance accurately.
Scattered Information Across Teams
Fragmented data sources add another layer of complexity to KPI tracking.
When project managers and accounting teams rely on separate datasets, it often leads to rework, inconsistent financial reports, and expensive errors. For example, field crews might update one spreadsheet while estimators and accountants use entirely different records. This lack of synchronization creates a disjointed view of project performance and delays decision-making.
The problem is widespread – only 12% of construction firms use digital tools across all their projects. Most still depend on physical records that can easily be lost or misplaced. These silos also strain relationships between field and office staff, especially when discrepancies in recorded hours or pay arise. Without a centralized system, teams often feel overwhelmed by data but lack the actionable insights needed to make informed decisions. Unsurprisingly, teams using isolated methods struggle to maintain consistent performance tracking compared to those with integrated systems.
Delayed Problem-Solving
A lack of real-time data can turn small issues into major setbacks. Productivity bottlenecks often come to light during weekly or monthly meetings – far too late to prevent the damage. For instance, a single delayed permit or unresolved RFI can lead to idle crews, cascading delays, and expensive change orders. This reactive approach forces teams into crisis mode rather than allowing for proactive management.
The disconnect between field updates and office operations only worsens the problem. Delays in approvals or documentation can mean missed chances to source alternative materials or reassign labor.
As CMS Construction Material Specialists explains:
Gut instincts aren’t enough. You need hard numbers to detect profit leaks and forecast cash needs.
Even a modest 5% cost overrun across multiple projects can take a significant toll on profit margins. Without real-time insights into critical KPIs like budgets and schedules, teams miss opportunities to address issues before they spiral out of control. This lack of visibility makes it nearly impossible to stay ahead of problems, ultimately hurting both performance and profitability.
sbb-itb-5eea312
How Real-Time Dashboards Fix KPI Tracking Problems
Real-time dashboards address common challenges in KPI tracking by replacing outdated, fragmented methods with a centralized and automated approach. They enable teams to monitor progress continuously and respond to issues as they arise.
Centralized Data Display
Dashboards eliminate the hassle of scattered data by consolidating it into a single, unified platform. They pull information from multiple sources – such as scheduling tools, accounting software like QuickBooks, equipment trackers, and field logs – and present key metrics like open RFIs, submittals, safety observations, labor costs, and cost comparisons in one cohesive view.
To make this work, data entry must follow consistent standards, including uniform cost codes and naming conventions, ensuring the insights are accurate.
When implemented correctly, the benefits are clear. For instance, the RAAF Base Curtin Redevelopment Project swapped traditional spreadsheets for a real-time project controls dashboard. This change drastically cut down the time needed for monthly reporting and enhanced financial risk management.
Automated Updates and Alerts
Automation is a game-changer in how teams respond to project changes. Instead of relying on manual reports, dashboards continuously update metrics and send alerts when critical thresholds are crossed – whether it’s a budget overrun, overdue submittal, or safety issue.
Take JRCRUZ, a New York City utility infrastructure contractor, as an example. They introduced real-time safety dashboards to track leading safety metrics, achieving an 84% drop in recordable incident rates and eliminating lost time incidents over 1,000,000 working hours. Similarly, Starkweather & Shepley used automated compliance alerts to help clients avoid regulatory penalties, minimizing delays and fines.
Karl Sorensen, Director of Project Solutions at HITT Contracting, captures the essence of this shift:
I call it on-demand data and real-time reporting. We gather data and metrics in real-time or near real-time to create a reporting structure that is a feedback loop to our project managers and our business unit leaders.
This approach replaces the outdated model where productivity issues were only identified during monthly cost meetings – often too late to fix. With real-time alerts, teams can act immediately, leading to faster and more effective decision-making.
Faster Insights for Better Decisions
Real-time dashboards don’t just highlight problems – they provide actionable insights that drive better decisions. By automatically flagging overdue tasks or high-risk items, they allow managers to intervene before minor issues escalate. For example, if submittals are nearing their deadlines or RFIs are delayed, dashboards ensure these risks are addressed promptly.
Given that 75% of construction firms now prioritize rapid decision-making in the field, this capability is increasingly indispensable.
Alex Six, Solution Specialist at Procore Technologies, explains:
Dashboards don’t replace project management – they inform it. The value isn’t in the data alone, but in what the team does with it: asking the right questions, spotting what doesn’t add up and acting before issues escalate.
BESIX Watpac exemplified this by integrating 360° photo documentation technology with a dashboard. This allowed teams to compare real site conditions with BIM models, reducing subcontractor disputes and ensuring project plans stayed on track. Spotting discrepancies early – before they lead to costly rework – is the key to keeping projects on time and within budget.
Platforms like Contractor Foreman bring these dashboard capabilities to the jobsite, combining real-time metrics, automated alerts, and quick decision-making tools to transform project management.
Key Construction KPIs Tracked by Dashboards
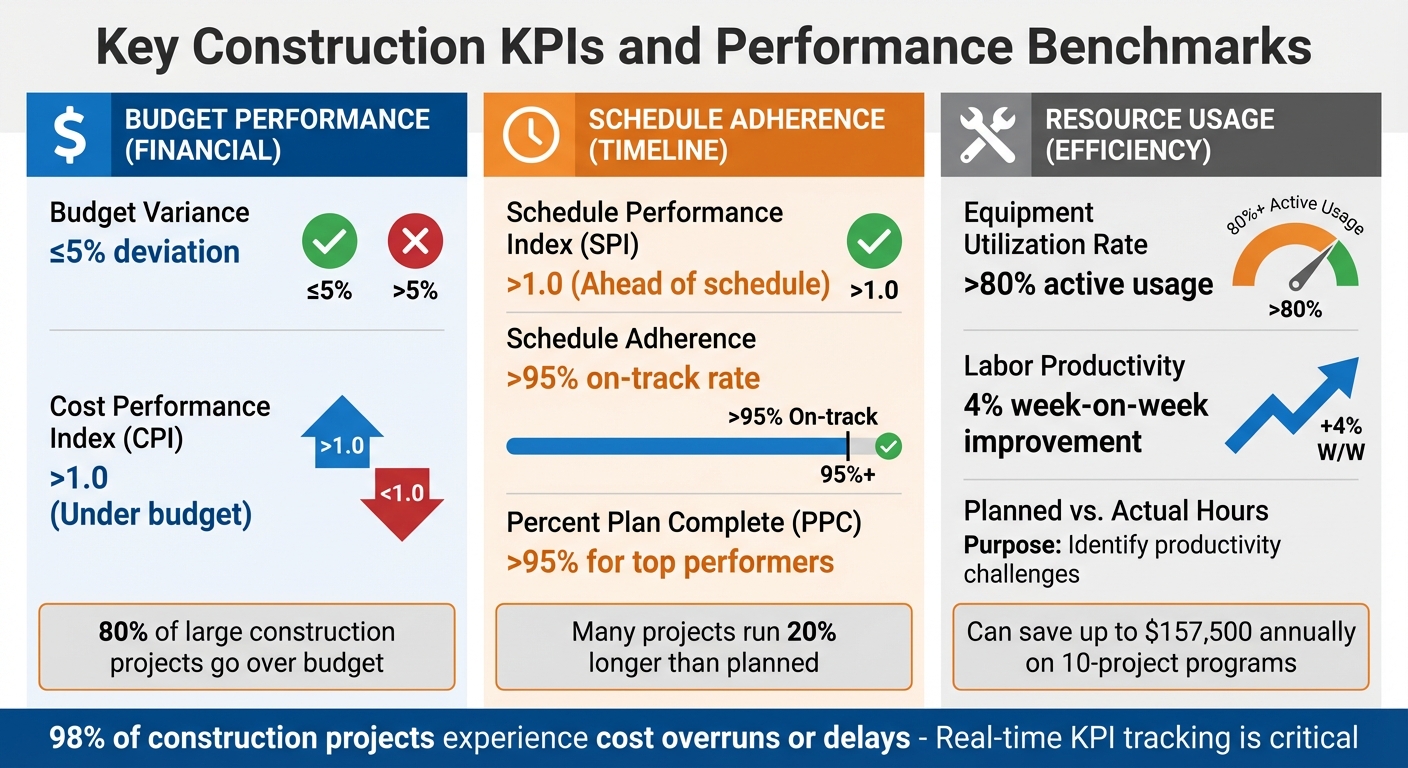
Key Construction KPIs and Performance Benchmarks for Real-Time Dashboard Tracking
Real-time dashboards are changing the game in construction by reducing data delays and fragmentation. These tools turn raw project data into actionable insights, helping teams track key metrics that can make or break a project. With 98% of construction projects experiencing cost overruns or delays, monitoring the right KPIs in real time is critical to staying on track financially and operationally. The most important metrics fall into three main categories: budget performance, schedule adherence, and resource usage. Together, these give project managers the clarity they need to address issues before they grow into major setbacks.
Budget Performance
Keeping a close eye on the budget is essential for any successful project. Dashboards track Budget Variance, comparing projected costs to actual spending. If the variance exceeds 5%, it’s a red flag that requires immediate attention. Another key metric is the Cost Performance Index (CPI), which measures the ratio of earned value to actual costs. A CPI above 1.0 means the project is under budget, while a CPI below 1.0 signals overspending.
Dashboards also calculate the Forecasted Final Cost (FFC), which estimates total project expenses by combining current costs with future projections. This includes accounting for subcontractor changes and potential risks. With around 80% of large construction projects going over budget, this predictive insight is invaluable for making timely adjustments.
Even 5% overruns across multiple jobs can crush profit margins – track this monthly.
Next up, ensuring the project stays on schedule is just as important.
Schedule Adherence
Delays are a common issue in construction, with many projects running 20% longer than planned. Dashboards use the Schedule Performance Index (SPI) to track progress. This metric compares the amount of work completed to the amount scheduled. An SPI above 1.0 means the project is ahead of schedule, while anything below that indicates delays.
Visual tools like S-Curves help teams see how cumulative progress compares to the plan over time, making it easy to spot when things start to slip. For short-term monitoring, Percent Plan Complete (PPC) measures how many weekly commitments teams and subcontractors meet. Top-performing builders aim for a PPC above 95%, and dashboards provide a clear way to track this goal week by week.
Finally, resource usage metrics shed light on where inefficiencies are eating into profits.
Resource Usage
Wasted resources can quickly drain a project’s budget. Dashboards track Labor Productivity by measuring output per labor hour, with high-performing teams targeting a 4% improvement each week. The Equipment Utilization Rate measures how often machinery is actively in use. A rate above 80% is considered excellent, as idle equipment adds unnecessary costs through rentals and depreciation.
Another critical metric is Planned vs. Actual Hours, which compares estimated labor time to the actual hours worked. This helps identify whether initial estimates were accurate and whether crews are working efficiently or facing productivity challenges. For example, automating resource tracking through dashboards can save a capital program with 10 projects up to $157,500 annually by reducing waste and optimizing resource allocation.
Here’s a quick overview of the key targets:
| KPI Category | Key Metric | Target Benchmark |
|---|---|---|
| Financial | Budget Variance | ≤5% deviation |
| Financial | Cost Performance Index (CPI) | >1.0 (Under budget) |
| Schedule | Schedule Performance Index (SPI) | >1.0 (Ahead of schedule) |
| Schedule | Schedule Adherence | >95% on-track rate |
| Resource | Equipment Utilization | >80% active usage |
| Resource | Labor Productivity | 4% week-on-week improvement |
Dashboard Features for Real-Time Construction Monitoring
The right dashboard can completely change how construction teams manage and respond to project performance. Modern dashboards combine live analytics, mobile access, and seamless integrations to turn raw data into actionable steps. For contractors juggling multiple sites, this means instant insights into budgets, schedules, and resources – without waiting until the end of the day.
Real-Time Analytics and Customizable Views
A good dashboard provides live data feeds that automatically refresh, offering visual indicators for key metrics like budget-to-actual spend, CPI (Cost Performance Index), SPI (Schedule Performance Index), and schedule adherence. Conditional formatting is often used to highlight issues, ensuring potential problems are flagged immediately.
Customization is just as critical. Instead of cluttering the screen with every possible metric, dashboards should focus on 3–5 key performance indicators (KPIs) per view, with options to dive deeper into specific data. For example, a project manager might track overall labor productivity at a glance, aiming for a 4% weekly improvement, and then explore details like crew performance or equipment usage exceeding 80%.
Features like color-coded charts, gauges, and trend lines make it easy to interpret data quickly. Dashboards can adapt to project phases too, shifting focus from procurement to commissioning or closeout as needed. This shift from static reports to dynamic, real-time data supports more proactive decision-making.
Contractor Foreman exemplifies these capabilities with its financial dashboard, which offers a high-level overview while letting users drill down into specifics like job costing, estimates, and change orders. Its flexible views also help teams track metrics like GPS-based timecards and equipment logs, ensuring only the most relevant data is front and center.
Mobile Access
Mobile-friendly dashboards are a must for managing projects spread across multiple locations. With mobile access, field teams can check KPIs, log daily progress, and respond to alerts in real time. This reduces response times from days to just minutes, enabling quick decisions about manpower, material deliveries, or equipment issues.
Field crews can update GPS-verified timecards, submit daily logs, and even process on-site payments, all while keeping the central dashboard updated.
Contractor Foreman’s mobile platform works across phones, tablets, and computers, offering full access to tools like financial tracking, scheduling, daily logs, and resource management from anywhere. Plus, with an average customer support wait time of just 13 seconds, contractors can get help fast when they need it most.
Integrations with Tools Like QuickBooks
Integrations with accounting tools like QuickBooks eliminate the need for duplicate data entry, ensuring financial metrics stay accurate in real time. When dashboards sync with systems like QuickBooks, updates to bills, expenses, and payments happen automatically, keeping budgets on track. This is especially important given that inaccurate data and reporting contribute to 14% of construction rework globally, costing an estimated $88.69 billion.
QuickBooks integration simplifies processes like updating contract amounts for change orders, tracking purchase orders to prevent overpayments, and linking online payments to the correct invoices. This creates a unified financial view without data silos or manual reconciliation.
Contractor Foreman connects seamlessly with QuickBooks Online (support for QuickBooks Desktop ended on January 1, 2026) and extends its reach via Zapier to over 50 other systems. These integrations ensure smoother workflows and better project outcomes by centralizing critical data in one place.
Steps to Implement Dashboards for Better Project Outcomes
Real-time dashboards can significantly improve project outcomes, but their success depends on proper implementation. Start with a solid plan, automate data collection, and ensure your team is well-trained. These steps will help you leverage dashboards to improve budget management, scheduling, and resource allocation.
Identify Key Metrics to Track
Pinpoint the critical questions that reveal your project’s health. Select 3–5 KPIs for each view, focusing on those that directly influence decision-making. Talk to project managers, estimators, and safety officers to learn which metrics they rely on most.
Prioritize metrics that predict future issues rather than just reporting past performance. For example, track leading indicators like open RFIs, productivity trends, or unresolved BIM clashes. These metrics can highlight potential problems before they escalate. As a benchmark, high-performing builders often achieve a 90–95% milestone completion rate, while top-tier safety performance typically involves fewer than 0.6 incidents per 10,000 labor hours. Use these benchmarks to establish meaningful targets.
Create role-specific dashboards tailored to the needs of different team members. Executives might prefer high-level summaries, such as safety statistics and overall costs, while field engineers benefit from detailed data like daily progress, material delivery schedules, and punch lists. Avoid tracking metrics that don’t lead to actionable steps – irrelevant data can create unnecessary distractions.
Set Up Automated Data Feeds
Integrate your accounting tools (e.g., QuickBooks), project management platforms, and field logs into a unified system. Tools like Zapier can help connect these systems and streamline data flow.
Start by mapping out where your data currently resides – whether in field logs, accounting software, or scheduling documents. Identify which data feeds need automation and set up daily syncs to ensure real-time updates. Use conditional formatting to flag KPIs that exceed thresholds, such as delays or budget overruns.
Platforms like Contractor Foreman simplify this process by offering direct integration with QuickBooks Online and compatibility with over 50 other systems through Zapier. This eliminates duplicate data entry and ensures financial metrics are always accurate. Once automated data flows are in place, focus on helping your team use these insights to make informed daily decisions.
Train Teams and Review Trends Regularly
Technology is only effective if people use it. Help your team understand the value of dashboards by explaining how they reduce repetitive tasks, streamline documentation, and simplify daily operations. Hands-on support, especially from experienced team members, can make the transition to new tools smoother.
Dashboards empower teams to ask better questions, identify inconsistencies, and address problems early. To ensure reliable results, emphasize consistent data entry practices, including standardized categories, cost codes, and reporting formats. Include these requirements in subcontractor agreements and offer setup assistance to maintain consistent data flow across the project.
Review trends weekly to catch issues early. Metrics like Percent Plan Complete (PPC) and Percent Roadblock Removed (PRR) can help measure team effectiveness. Regularly examine “Reasons for Variance” charts to identify whether RFIs, inspections, or change orders are causing delays. Treat dashboards as a conversation starter rather than the final word – always verify that data is accurate and up-to-date before making critical decisions. Ongoing training reinforces proactive decision-making and ensures teams stay aligned.
Contractor Foreman also provides free training and support to help teams quickly adapt to new systems and address challenges as they arise.
Conclusion
Real-time dashboards have stepped in to replace the chaos of scattered spreadsheets and endless email chains, offering a centralized and dynamic view of project health. By focusing on key areas like budget, schedule, and resource management, these dashboards provide a powerful, all-in-one solution. They help teams spot problems early – whether it’s delayed submittals or budget discrepancies – so action can be taken before things spiral out of control.
The key to success lies in choosing the right metrics, automating data inputs, and ensuring your team sees the value these tools bring. This approach reduces miscommunication and speeds up decision-making.
As Alex Six, Solution Specialist at Procore Technologies, puts it:
Dashboards don’t replace project management – they inform it. The value isn’t in the data alone, but in what the team does with it: asking the right questions, spotting what doesn’t add up and acting before issues escalate.
Contractor Foreman exemplifies these benefits with its comprehensive platform. It offers real-time tracking for budgets, schedules, and resources, integrates seamlessly with QuickBooks, and provides mobile access. With over 35 contractor-specific features, it eliminates duplicate data entry and delivers instant project visibility. Plans start at just $49 per month, and a 30-day trial lets you explore it risk-free.
Whether you’re handling one project or managing an entire portfolio, real-time dashboards deliver the insights you need to make smarter decisions, cut down on waste, and complete projects on time and within budget. As the construction industry leans into mobile-first, data-driven management, teams adopting these tools now will gain a competitive edge. Staying ahead in today’s fast-moving construction world depends on embracing this shift.
FAQs
Which 3–5 KPIs should I track first?
Tracking project progress, budget variance, and resource usage is crucial for keeping a close eye on schedules, costs, and efficiency in real-time. These key metrics give you a clear picture of whether your construction projects are staying on schedule and within budget, while also ensuring resources are being used effectively.
How do real-time alerts prevent cost overruns and delays?
Real-time alerts provide instant insights into how a project is progressing, helping to avoid cost overruns and delays. By flagging potential issues as they arise, these alerts allow teams to respond quickly and effectively, tackling problems before they grow out of control. This kind of immediate awareness plays a key role in keeping projects both on budget and on schedule.
How do I connect my field data and QuickBooks to a dashboard?
To link your field data and QuickBooks with a dashboard in Contractor Foreman, begin by exporting the necessary field data or invoices – usually in a CSV format. Next, use Contractor Foreman’s integration tools to sync with either QuickBooks Online or Desktop, allowing for real-time updates. Be sure to follow the setup guides provided to configure everything correctly. Once the systems are connected, your dashboards can display real-time KPIs such as budget, schedule, and resource usage, giving you a clear and updated view of your project metrics.