Do you keep getting complaints about “confusing” reports and “last-minute” surprises and “missing” data—even though the data is 100% there?
The file exists somewhere in the dashboard. For you, it’s so easy to find. For everyone else, it apparently takes five tabs, three filters, and a guess. So who’s at fault here—you for not “setting it up properly”, or the team for not following your instructions. Hard to tell.
But if you know deep down that you’re an organized contractor, nine times out of time, it’s not you. It’s not your team either.
It’s your dashboard!
Your real issue isn’t that you’re disorganized or noncompliant. It’s visibility across your construction projects.
That’s the problem dashboard software is meant to address.
Dashboard software gives contractors a way to pull schedules, budgets, and reports into a single visual view—charts, timelines, and metrics that make issues visible before they become expensive.
Finding the right dashboard, though, isn’t simple—it’s not as easy as choosing snacks for the team or buying a box of work gloves. It has to reflect how your projects actually run and how your team communicates.
This checklist breaks down what to look for in dashboard tools, with a focus on features that actually matter for U.S. construction teams.
Key Takeaways:
- Custom Dashboards: Ensure tools allow personalized views with widgets for costs, schedules, and safety metrics.
- Role-Based Views: Different team members need dashboards specific to their responsibilities.
- Real-Time Data: Updates should reflect changes instantly, not hours later.
- Drill-Down Features: Easily navigate from high-level metrics to detailed records.
- Construction Metrics: Track cost variance, schedule performance, labor productivity, safety incidents, and quality issues.
- Integrations: Sync with accounting tools like QuickBooks and project management platforms.
- Security: Use role-based access controls, encryption, and audit trails to protect sensitive data.
- Ease of Use: Mobile-friendly interfaces for field staff and intuitive tools for office teams are essential.
- Pricing: Request transparent pricing in USD, including licenses, training, and potential add-ons.
The Smart Way to to Evaluate Vendors:
- Create a scorecard to evaluate vendors based on customization, integrations, security, usability, and cost.
- Test software with real project data during demos to ensure it fits your workflows.
- Run pilot programs with active projects to gather feedback before committing.
This checklist ensures you choose software that simplifies operations, keeps data accurate, and meets the demands of your jobsite.
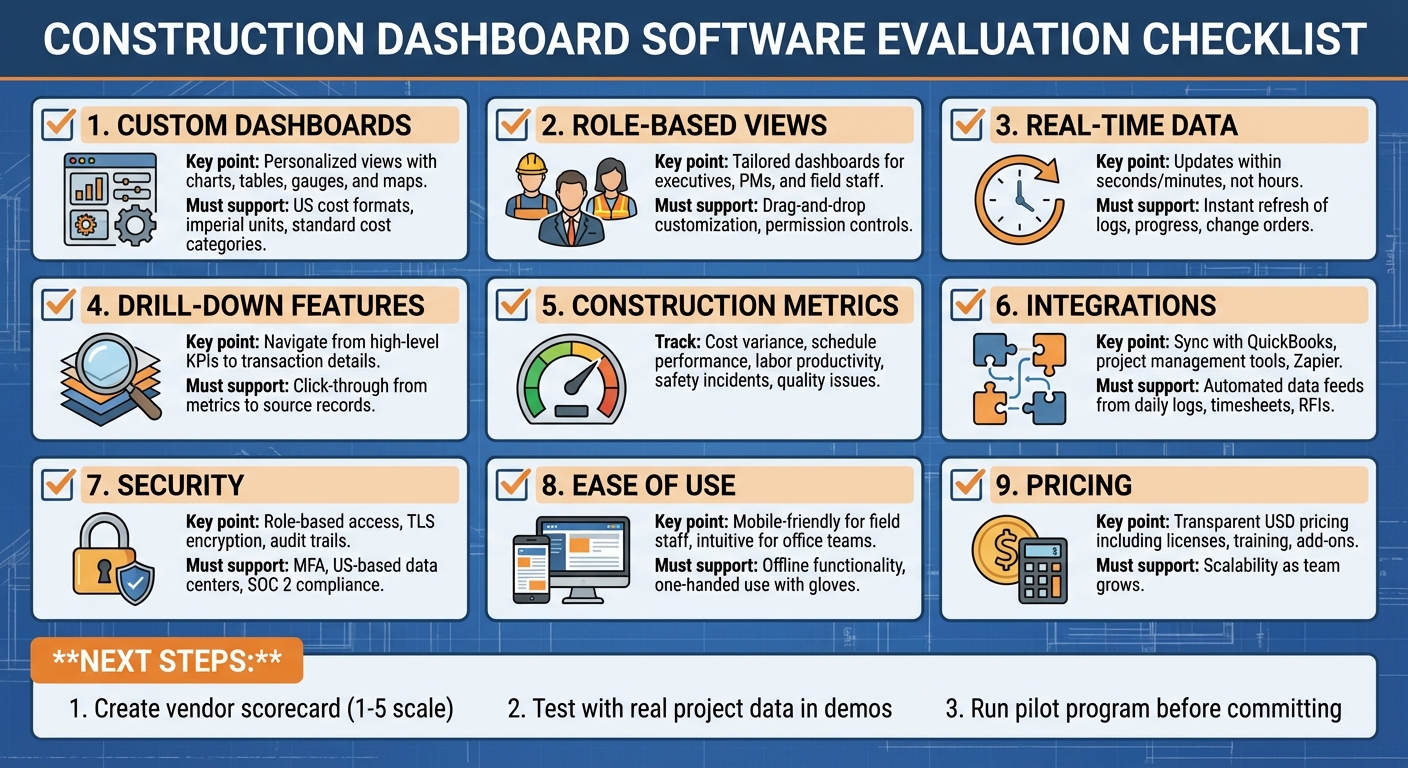
Construction Dashboard Software Evaluation Checklist: 9 Essential Criteria
Core Dashboard Features
These features are at the heart of the evaluation criteria discussed earlier.
Custom Dashboards and Widgets
The best dashboard tools let you design tailored views by tweaking widgets like charts, tables, gauges, and maps. Forget generic layouts – your dashboards should fit your workflow. For example, a project manager might prefer a screen displaying a budget-versus-actual cost chart, a schedule variance graph, an open change orders list, and a safety incident gauge – all in one place.
When assessing software, check if the widgets support U.S. construction standards: costs displayed with commas, imperial units like feet and yards, and standard cost categories such as labor, materials, equipment, subcontracting, overhead, and retainage. Many modern systems combine project financials, daily logs, and schedule updates into a single customizable dashboard accessible via web and mobile. Test whether you can easily switch chart types – bar, line, pie, or gauge – and apply filters like project, date range, or status without needing IT support.
Just as important, dashboards should adapt to the specific roles of your team members.
Role-Based Views and Layout Options
Different roles demand different information. Executives need a portfolio view with margin, cash flow, and risk indicators across all projects. Project managers require details like budgets, committed costs, open change orders, and schedule health for individual projects. Meanwhile, superintendents and field staff need quick access to daily log summaries, open punch-list items, safety incidents, RFIs due, scheduled inspections, and the day’s work plan – all from their phones or tablets.
Look for software that provides role-based presets, so new users see dashboards tailored to their responsibilities right from the start. At the same time, customization should still be possible, with permission-based controls. Features like drag-and-drop widget placement, resizable panels, and the ability to rearrange or hide sections are crucial. You should also be able to save and share layout templates with team members in similar roles and create specialized dashboards for different phases of a project, such as bidding, construction, or closeout.
Real-Time Data and Drill-Down Features
Customizable views and role-specific layouts are only as good as the data they display. Real-time data capabilities are essential for making quick, informed decisions. In construction dashboards, “real-time” means updates occur within seconds or minutes after changes are entered – not hours later in an overnight batch process. Critical data like daily logs, manpower counts, progress updates, and approved change orders should refresh almost instantly. If your dashboard shows a project is over budget or behind schedule, you need the ability to act immediately, and that requires up-to-date information.
Drill-down functionality is equally important. Dashboards should allow you to move seamlessly from high-level metrics to transaction-level details. For example, you might click on a project margin KPI to view the budget-versus-actual breakdown, then dive deeper into specific cost codes, and finally access the individual purchase order, subcontract, or change order causing the variance. The same applies to schedules: you should be able to navigate from a variance gauge to impacted milestones, to affected activities, and then to related RFIs or roadblocks. Direct links to source records ensure you can take corrective action without jumping between systems.
Construction Metrics and Integrations
Construction Metrics to Track
When setting up your dashboard, it’s crucial to focus on metrics that directly influence your bottom line. At the very least, track these five key areas: cost variance (budget versus actual spending), schedule performance (planned milestones versus actual progress), labor productivity (output per crew hour), safety incidents (including recordables, near-misses, and lost-time injuries), and quality issues (such as defects, rework costs, and punch list items). These categories directly impact profitability, risk levels, and overall project satisfaction.
For cost tracking, include a clear breakdown of budgeted, committed, and actual costs by cost code and trade. Use visual indicators – like red, yellow, or green flags – to highlight overruns. Also, display change orders, projected final costs, and cash flow trends so project managers can quickly identify and address margin erosion. On the scheduling side, incorporate S-curves to compare baseline plans with actual progress, percent completion metrics, and the number of days projects are ahead or behind schedule. For labor productivity, track labor hours against budget, daily production quantities (e.g., square feet installed or cubic yards poured), and cost per unit. This helps superintendents adjust crew sizes or methods as needed. Safety metrics should cover total incidents, OSHA recordables, days since the last incident, and the status of corrective actions. Finally, quality dashboards should detail defect counts by subcontractor, rework hours and costs, and inspection pass rates. This data can help pinpoint recurring issues and guide corrective measures.
To make these metrics actionable, ensure your dashboard automatically integrates with core project data sources.
Data Sources and Integration Options
A dashboard is only as reliable as the data feeding into it. Automated data feeds are essential to maintain accuracy and consistency. Your software should pull real-time data from daily logs, timesheets, RFIs (Requests for Information), submittals, change orders, punch lists, and equipment logs. These sources offer a comprehensive view of the project. For example, daily logs and timesheets provide insights into production rates, labor hours, and site conditions, enabling real-time analysis of productivity and costs. RFIs and submittals highlight bottlenecks by tracking response times and their impact on schedules. Change order data, meanwhile, offers visibility into revenue opportunities and risks to profit margins by monitoring pending, approved, and rejected changes against the original contract value.
Integration with your accounting or ERP system – such as QuickBooks – is a must. This connection ensures job costs, vendor invoices, and cost codes are synced in real time, providing up-to-date insights into cost-to-complete, cash flow, and overall profitability. Similarly, linking the dashboard to project management platforms allows for live updates on RFIs, commitments, and schedule changes. Tools like Zapier can further streamline workflows by automating data transfers between email, forms, CRM systems, and other applications. For instance, the dashboard can automatically update when new RFIs are created or change orders are approved, eliminating the need for manual data entry.
All-in-one platforms like Contractor Foreman simplify this process by combining project management, financial tracking, scheduling, and daily logs into one system. These platforms often come with built-in integrations for QuickBooks and Zapier, reducing the complexity of managing multiple tools and ensuring your dashboard pulls consistent data across both field and office operations.
US Formats for Cost, Dates, and Measurements
Lastly, ensure your dashboard adheres to US formatting standards for cost, dates, and measurements. Consistency in data presentation is key for effective decision-making. For financial figures, use the US currency format (e.g., $1,250,000.50). Display dates in the MM/DD/YYYY format, and use imperial units for measurements (feet, square feet, cubic yards, °F). This formatting should be applied across all dashboard elements, including widgets, drill-down views, and exported reports (PDFs, Excel files). During setup, test the software with a sample project that includes multi-million-dollar budgets, mixed measurement units, and various date entries to confirm it handles US conventions correctly in all views and reports.
Security and Access Control
User Permissions and Role-Based Access
Dashboard software needs to define who has access to specific information and actions. A system with granular, role-based access ensures that each user – whether an owner, project manager, superintendent, foreman, accountant, or subcontractor – can only view, edit, or approve content relevant to their role. Look for software that supports permission templates for standard roles, allows custom roles for unique organizational needs, and provides project-level access so external collaborators can only see data tied to their work. For example, sensitive financial metrics like job costs, profit margins, change order values, and payroll data can be restricted to accounting teams and executives, while field staff access only operational metrics.
Adopt a least-privilege model, where each role is granted access only to the dashboards and metrics necessary for their tasks. Office personnel may require visibility into cost-to-complete, budget versus actuals in US dollars, and unapproved change orders. In contrast, field crews might focus on schedule performance, manpower counts, safety incidents, and punch-list progress for their specific projects. They wouldn’t need access to company-wide profitability or contract details. Client portals should highlight high-level schedule milestones and approved contract values, while subcontractors are limited to their commitments and unresolved issues. Platforms like Contractor Foreman simplify this process by integrating role-based dashboards and client/subcontractor portals, ensuring all data remains secure yet accessible to the right users.
Data Security and Compliance Features
Controlling access is just one part of the equation – protecting your data is equally important. Use TLS/HTTPS encryption to safeguard data during transmission and encrypt stored data in production databases and backups. Strong authentication measures are essential, so ensure the system supports complex passwords, optional multi-factor authentication (MFA), session timeouts, and device management controls. Vendors should store data in secure, US-based data centers and implement regular vulnerability scans and patching programs.
To maintain accountability, the software should include detailed audit trails that log every action – such as viewing, creating, editing, or deleting records – alongside timestamps and any changes made. These logs should cover key metrics like costs, change orders, safety incidents, and timesheets, helping with internal controls, dispute resolution, and external audits. Features like exportable audit logs, read-only “locked” periods after financial close, and role-based approval workflows establish clear accountability. Always request documentation of the vendor’s security practices, such as security whitepapers or SOC 2 audit reports, as well as their data handling and privacy policies.
Backup and Disaster Recovery Options
Even with strong security measures, reliable backup and recovery systems are a must. Vendors should perform automated daily backups stored in geographically redundant locations to safeguard against local data center failures. A solid disaster recovery plan should outline recovery time objectives (RTO) and recovery point objectives (RPO) – for instance, restoring services within 15 minutes to 24 hours. This is especially critical for US contractors working across time zones with tight deadlines.
Ensure vendors conduct and log test restores and disaster recovery drills. Backups must be encrypted and protected from tampering or ransomware attacks. When evaluating a vendor, ask about their backup frequency, retention policies, uptime SLAs (typically 99.5–99.9% annually), and how they notify customers of incidents. Platforms like Contractor Foreman consolidate data from project management, financial tracking, scheduling, and daily logs, making it easier to maintain consistent backup and recovery protocols across all modules. This reduces the risk of data loss or exposure caused by unregulated spreadsheets or standalone tools.
sbb-itb-5eea312
Usability, Implementation, and Pricing
Ease of Use for Field and Office Staff
Dashboard software needs to cater to both field crews and office teams effectively. A modern interface with clear labels, minimal clicks for tasks like updating logs or reviewing budget reports, and mobile optimization is essential. For field apps, features like offline functionality, quick load times, and one-handed usability (even with gloves) are critical. On the office side, desktop views should allow for easy filtering, sorting, and exporting of data.
Before committing to a platform, it’s smart to test it in action. For instance, have foremen and crew leads use the mobile app on an active project for one to two weeks. Tasks like daily reporting, completing safety checklists, and photo documentation are great ways to evaluate its performance. Pay attention to connection reliability, sync speed, GPS accuracy, and how well it handles tough conditions. Gather daily feedback from users to identify what’s confusing, slow, or particularly helpful. This hands-on approach ensures the software fits your workflows rather than just looking polished during a demo.
Once you’ve confirmed usability, the focus shifts to fast implementation and strong support.
Training, Support, and Setup Time
After confirming that the software is easy to use, the next step is ensuring a smooth implementation process. The time required for setup can vary – ranging from weeks to months – depending on factors like data complexity, required integrations, and the number of users. To speed things up, look for vendors that include training as part of their service. Options like live onboarding sessions, on-demand video tutorials, and role-specific training for both field and office users can significantly streamline the process. Prebuilt templates for dashboards, reports, and checklists are another time-saver, letting you start with industry-tested setups instead of building everything from scratch.
Equally important is understanding the level of ongoing support once the system goes live. Look for vendors offering multiple support channels, such as phone, email, and chat, during U.S. business hours. Clear response times for critical issues (based on SLAs) and a searchable knowledge base are also key. For example, Contractor Foreman provides live support from 7 AM to 7 PM ET, Monday through Friday, with an average wait time of just 13 seconds. They also boast a 95% satisfaction rate for support chats and assign a dedicated Customer Success Manager to assist with onboarding and long-term success. Be sure to ask vendors about their typical first-response and resolution times for high-priority issues, especially those that could disrupt active projects.
Pricing and Scalability
Once performance and support meet your needs, it’s time to dive into pricing. Request a detailed pricing breakdown in USD that covers license types, implementation fees, training costs, support tiers, data storage, and API fees. Calculate your total monthly and annual costs based on current staff size and projected growth. Don’t overlook potential extra charges for additional projects, advanced features, or premium dashboards. Common pricing models include per-user-per-month subscriptions, per-project pricing, or flat-rate plans for unlimited users.
Pricing should also align with the varying needs of field and office teams. All-in-one platforms like Contractor Foreman – offering project management, financial tools, scheduling, daily logs, and dashboards starting at $49/month – can simplify budgeting by reducing the need for multiple subscriptions and integrations. To ensure the platform grows with your business, ask about pricing adjustments as you add more users or projects, limits on dashboards or data storage, and system performance as you scale from a small contractor to a multi-office operation. Cloud-based systems with proven multi-project reporting capabilities are generally better suited to handle growth without performance issues or disruptive migrations.
Final Recommendations
Key Points from the Checklist
When building your construction dashboard, focus on the essentials that will make it effective and user-friendly. Start by ensuring customization options and role-based views are in place. This way, owners, project managers, and field crews can access the KPIs and workflows that matter to them – without unnecessary clutter. Real-time data and integrations with scheduling, accounting, and field apps are also critical. These features reduce manual data entry and help keep your dashboards accurate and up-to-date. Don’t forget to track construction-specific metrics like cost versus budget, schedule performance, change orders, and safety incidents, all formatted to meet US standards.
Security is another key factor. Role-based access controls are essential for protecting sensitive financial data while still allowing field teams to access the information they need. Usability should not be overlooked either – both office staff and field crews need an interface that’s intuitive and mobile-friendly, with fast loading times. Lastly, consider pricing transparency and scalability. Calculate the total cost of ownership over three to five years, including expenses like licenses, training, integrations, and projected growth. These criteria will help you evaluate platforms with confidence.
Next Steps
To narrow down your options, create a scorecard to rate vendors on key factors like customization, integrations, security, usability, and pricing, using a 1–5 scale. During vendor demos, ask them to build a sample project dashboard using real data – such as a current project’s budget, schedule, and safety metrics. This allows you to see how the software handles live workflows instead of relying on generic presentations. Be sure to document whether features are built-in, require add-ons, or depend on third-party tools, and take note of any additional costs.
Next, run a pilot program with one or two vendors on a few active projects. Involve key team members, such as project managers, field supervisors, and accounting staff, and gather structured feedback using consistent evaluation questions for each tool. This hands-on testing will reveal how the software performs under actual working conditions, including connection reliability, sync speed, and compatibility with your workflows. After reviewing the pilot results, negotiate terms with your chosen vendor and plan a phased rollout. Set clear metrics for success, such as reducing reporting time or improving schedule adherence, to measure the software’s impact effectively.
FAQs
What key features should contractors look for in dashboard software?
When selecting dashboard software for construction projects, focus on features that make managing tasks and tracking progress easier. Key tools to look for include project management capabilities, financial tracking options, and real-time data updates to keep everyone on the same page. It’s also helpful if the software offers document management, mobile access, and integrations with the tools your team already relies on. Don’t overlook the importance of a simple, user-friendly interface and reliable customer support to ensure the software is easy to adopt and use effectively.
How does dashboard software help contractors make better decisions during construction projects?
Dashboard software empowers contractors by providing real-time access to essential project details like budgets, schedules, and performance metrics. With this instant visibility, contractors can identify potential problems early, make timely adjustments, and allocate resources more efficiently.
By consolidating complex data into a single, user-friendly interface, these tools simplify decision-making. They ensure that every choice is informed by accurate, up-to-date information, leading to smoother workflows and better project results.
Why is data integration important for effective dashboard software?
Data integration plays a key role in making dashboard software effective. It brings together information from different systems into a single, centralized location. This means you can access real-time, accurate data without the hassle of jumping between platforms. The result? Easier tracking of progress, smoother project management, and better decision-making.
When data flows smoothly between systems, it not only saves time but also minimizes errors. This is especially valuable when you’re juggling complex tasks or handling multiple projects at once, as it boosts efficiency across the board.
Related Blog Posts
- How Jobsite Safety Dashboards Improve Reporting
- Best Construction Risk Assessment Software 2025
- How to Track Construction KPIs with Dashboards