
- Quick Comparison
- What Good Crew Utilization Tracking Looks Like
- 1. Billable Hours Utilization
- 2. Idle Time on Site
- 3. Overtime Hours and Premium Cost
- 4. Crew Capacity Utilization
- 5. Labor Cost by Project
- 6. Rework Time and Cost
- 7. Schedule Fill Rate
- How the 7 Metrics Work Together
- Using Construction Software to Track Crew Utilization
- Conclusion
- FAQs
- Related Blog Posts
Dave, the framer, is sprinting between two houses like he’s being paid by the step count.
John, the electrician, seems to have enough downtime to send ten memes in the GC group chat.
Same payroll. Wildly different output.
Labor hours usually slip in the same places: idle time, overtime, rework, weak scheduling, and miscoded time. Tracking seven crew metrics helps show where paid hours stop turning into job progress — and where guys like John are quietly costing you more than guys like Dave are saving you.
If you’re thinking “eh, I’ll just eyeball it, it’s no biggie! I don’t want to micromanage.” — think again, because “eyeballing it” is exactly how you lose thousands of dollars. And by the way, this isn’t micromanaging. It’s just good management.
A crew of five at $45/hour costs about $9,000 per week. If 20% of that time is unproductive, about $1,800 per week produces no progress at all.
Seriously, why waste $1,800 a week when construction tools like Contractor Foreman can flag idle crew time before it shows up on payroll.
So what metrics should you actually be tracking?
The seven metrics below connect labor time, labor cost, and schedule pressure so field teams can spot the “Johns” before margin drops.
Main takeaways:
- Billable hours utilization shows how much paid time ties to project work.
- Idle time shows where crews are waiting instead of working.
- Overtime and premium cost show the price of lost time and schedule pressure.
- Crew capacity utilization shows whether crews are underloaded or stretched.
- Labor cost by project ties hours to budget impact.
- Rework time and cost shows labor lost to fixing completed work.
- Schedule fill rate shows whether future crew time is fully assigned.
Quick Comparison
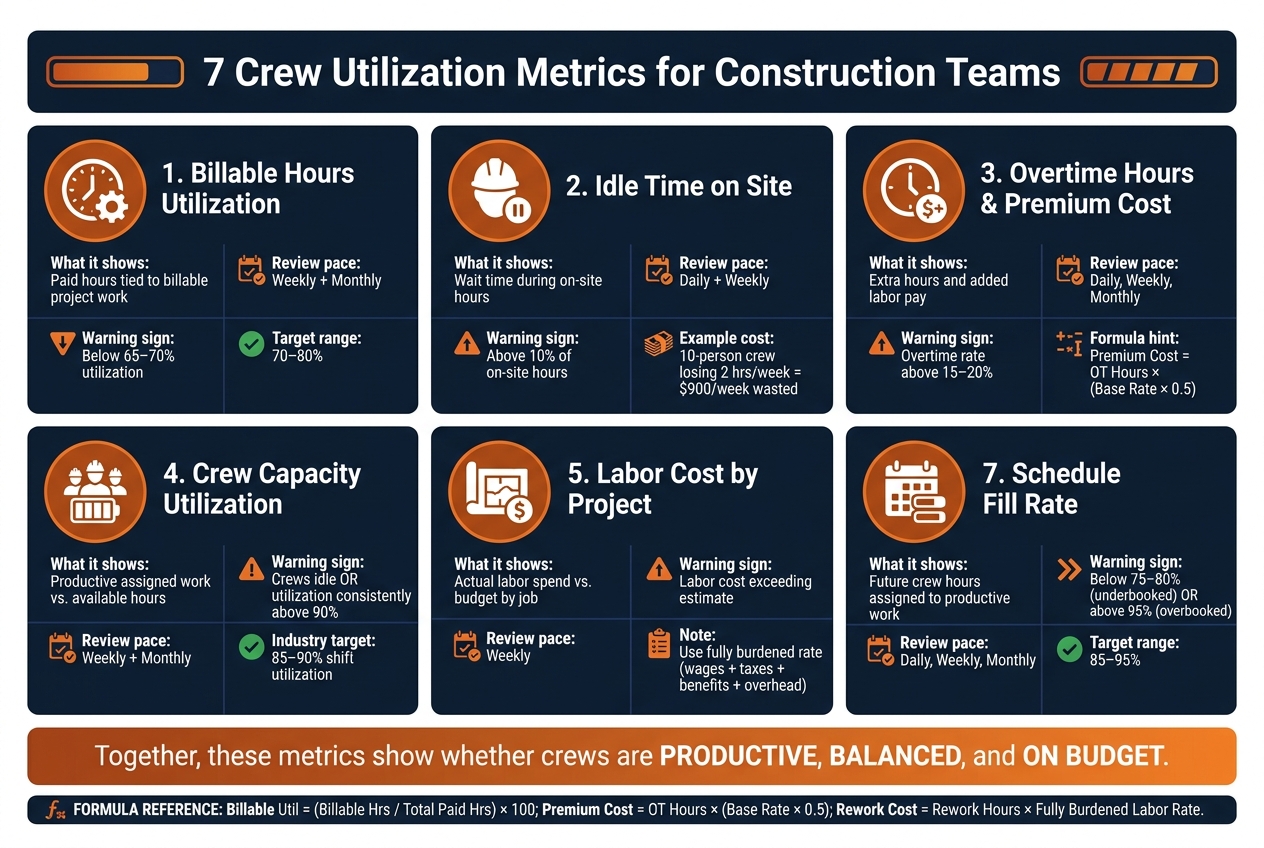
7 Crew Utilization Metrics for Construction Teams
| Metric | What it shows | Common review pace | Main warning sign |
|---|---|---|---|
| Billable hours utilization | Paid hours tied to billable work | Weekly, then monthly | Low billed share of paid time |
| Idle time on site | Wait time during on-site hours | Daily, then weekly | Repeated delays from materials, inspections, or handoffs |
| Overtime hours and premium cost | Extra hours and extra labor pay | Daily, weekly, monthly | Overtime above 15%–20% |
| Crew capacity utilization | Productive assigned work vs. available hours | Weekly, then monthly | Crews sitting idle or running too hot |
| Labor cost by project | Actual labor spend by job | Weekly | Labor cost above estimate |
| Rework time and cost | Hours and dollars spent fixing work | Daily, then weekly | Rework above about 5% |
| Schedule fill rate | Future crew hours assigned to work | Daily, weekly, monthly | Fill rate below 75%–80% or above 95% |
Taken together, these numbers show one thing: whether crews are productive, balanced, and on budget. The value comes from tracking them on a set schedule and tying each review to one clear field action.
sbb-itb-5eea312
What Good Crew Utilization Tracking Looks Like
Good crew utilization tracking comes down to four inputs: accurate field time, the right job and cost code for every hour, clear schedules, and project-level labor reporting that pulls it all together.
That sounds simple. In practice, this is where a lot of teams slip.
If workers enter time the same day, and that time is tied to the right project and task, your labor data stays clean. If time gets filled out at the end of the week from memory, hours often land on the wrong project or cost code. Once that happens, utilization numbers start drifting, and the report stops telling the truth.
When those inputs are clean, the metrics below are far more dependable.
Track planned hours vs. actual hours at a few levels:
- Worker
- Crew
- Trade
- Project
Each view helps answer a different question. At the worker level, you can spot performance issues. At the crew level, you can see overtime pressure. At the trade level, you can find capacity gaps. At the project level, you can keep an eye on the labor budget.
One practical benchmark: industry guidance often targets a shift utilization rate of 85–90%, calculated as (Productive Time ÷ Total Shift Time) × 100.
Platforms like Contractor Foreman can put GPS timecards, scheduling, daily logs, labor cost tracking, and QuickBooks integration in one place, so hours, assignments, and job costs stay in sync. With that system in place, the first metric to review is billable hours utilization.
1. Billable Hours Utilization
What It Is and Why It Matters
Billable hours utilization shows how much paid crew time is tied to job-coded project work. Put simply, it tells you how much of the time you’re paying for is going toward work you can bill.
Nonbillable time covers things like safety meetings, travel, training, yard work, and similar tasks. That time still costs money, so when utilization slips, job margin usually slips with it.
The Formula
Billable Hours Utilization (%) = (Total Billable Crew Hours ÷ Total Paid Crew Hours) × 100
Here’s a simple example: if a crew logs 32 hours of project work in a 40-hour week, utilization is 80%.
For field crews, a common target is 70–80%. Once you get above 85%, that can point to burnout or quality risk. More hours billed sounds great on paper, but if the crew is stretched too thin, problems tend to show up somewhere else.
To keep this KPI useful, set clear rules for what counts as billable and what does not. That includes gray areas like drive time or mobilization. If one team codes those hours one way and another team does the opposite, the number stops being useful from one week to the next.
Review Cadence
Review this weekly at the field level. Foremen and project managers should check that hours are coded to the right jobs and flag crews with low billable percentages.
Then review it monthly at the leadership level alongside labor cost and gross margin data. That makes it easier to spot patterns over time and adjust staffing or pricing before small leaks turn into bigger ones.
Management Actions It Supports
Low utilization – especially below 65–70% – usually points to one of a few problems: not enough active work, weak planning, or admin delays that eat into the day.
That data also helps with estimating. If past jobs show that crews spend more paid time on nonbillable work than expected, you can price labor more accurately by improving your construction estimating and carry that into your next bid.
If billable hours look strong but output is still lagging, idle time is the next thing to check.
2. Idle Time on Site
What It Is and Why It Matters
When billable hours look low but the crew was still on site, idle time usually explains the gap. This is paid time spent waiting instead of working. Think delayed deliveries, inspections that haven’t happened yet, trade handoffs that stall out, unclear direction, or other jobsite slowdowns.
It’s not the same as planned downtime. Breaks and safety meetings are expected, scheduled, and built into the budget.
Here’s how fast idle time adds up: if a 10-person crew loses two hours a week at a fully loaded labor rate of $45/hour, that’s about $900 per week in labor cost. It doesn’t always jump off the page, but it can chip away at job margin little by little.
The Formula
Track idle time in both hours and percentage.
Idle Time (hours) = Total On-Site Hours − Productive Work Hours − Planned Non-productive Hours
Idle Time (%) = (Idle Time Hours ÷ Total On-Site Hours) × 100
For example, say a 6-person crew is on site for 8 hours. That gives you 48 total on-site hours. If 38 hours go to productive work and 4 hours go to breaks and safety, idle time comes out to 6 hours, or 12.5%.
A practical target is to keep idle time under 10% of total on-site hours. If it keeps running above that line, there’s probably a planning or coordination issue somewhere in the flow of work.
Review Cadence
Foremen should review idle time daily at the end of each shift. The goal is simple: log the wait time, code it by cause, and note why the crew was idle.
Project managers should review it weekly and look for patterns. For instance, maybe idle time jumps every Monday because materials weren’t staged before the weekend. That kind of pattern gives you something you can fix – move deliveries up, tighten trade handoffs, or resequence the work so crews aren’t standing around.
Management Actions It Supports
Daily logs and time codes help tag each idle period by cause, which makes the bottleneck easier to spot. In most cases, a quick root-cause check points to the issue: materials, inspections, or another trade holding things up.
Cross-training can help too. If workers can shift to other tasks when one dependency slips, they’re less likely to sit idle.
High idle time also tends to show up later as overtime. When too much time is lost during the day, crews often try to make up that production after hours.
3. Overtime Hours and Premium Cost
What It Is and Why It Matters
When lost time spills into nights or weekends, this metric shows what that delay is costing you.
Overtime hours are any hours worked beyond 40 in a workweek for non-exempt employees. Premium cost is the extra pay on top of straight time, usually 0.5× the base rate for each overtime hour.
Here’s the simple math. A carpenter earning $30/hour earns $45/hour in overtime. Across a crew, that extra pay stacks up fast: 40 overtime hours at that rate creates $600 in premium cost.
And the issue usually goes beyond payroll. When overtime sticks around week after week, crews get tired. Tired crews tend to slow down, make more mistakes, redo work, and face more safety risk.
The Formula
Track both the hours and the added cost:
Overtime Rate (%) = (Total Overtime Hours ÷ Total Hours Worked) × 100
Overtime Premium Cost ($) = Overtime Hours × (Base Rate × 0.5)
For example, if a framing crew logs 200 total hours in a week and 40 of those hours are overtime, the overtime rate is 20%. If the base rate is $35/hour, the premium cost for those 40 hours is $700.
Many contractors start watching this closely when the overtime rate keeps landing above 15%–20%. On the cost side, overtime premium above 5%–10% of the planned labor budget often means staffing or scheduling needs another look.
Review Cadence
Foremen should check top construction timesheet software daily so they can catch overtime before payroll closes. Project managers should review weekly overtime by crew and by project. Leadership should look at monthly patterns across active jobs.
Management Actions It Supports
Start with schedule pressure. Tighten material deliveries, clean up sequencing, and coordinate inspections and subs so crews aren’t stuck waiting and then scrambling to make up time.
If the issue is workload, shift crews, add labor at regular rates, spread work across jobs, and require overtime pre-approval.
If overtime still stays high after those changes, the next place to look is crew capacity.
4. Crew Capacity Utilization
What It Is and Why It Matters
Crew capacity utilization answers a simple question: out of all the hours your crew was available to work, how many went to productive, assigned tasks?
This matters because both extremes can hurt a job. If a crew is underused, you’re paying for time that isn’t pushing the project ahead. If a crew is stretched too thin, quality and safety can take a hit. And when utilization drops, that often points to upstream delays, not poor crew performance.
It also helps explain a common headache on jobsites: overtime stays high, but progress still feels stuck. In that case, crew capacity can show whether the real problem is overload, not just schedule pressure.
The Formula
Crew Capacity Utilization (%) = (Productive Labor Hours ÷ Available Labor Hours) × 100
Productive hours means time spent on assigned work tasks only. It does not include waiting, travel between sites, or rework. Available hours means total scheduled hours, minus approved leave, holidays, and weather shutdowns.
Here’s a plain example. A framing crew with 10 workers is scheduled for a 40-hour week. That gives the crew 400 available labor hours. If 320 of those hours are spent on framing, utilization is 80%.
Review Cadence
Field supervisors should review utilization every week. That gives them time to shift assignments or pull work ahead before a small gap turns into a schedule slip.
Project managers should look at it monthly across active jobs. That kind of review can show patterns a single week might miss. For example, if one crew keeps running low, the issue may be planning or coordination – not just a slow week.
It also helps to compare this metric by:
- Trade
- Job type
- Month
Looking at it as one company-wide number can hide what’s actually going on.
Management Actions It Supports
When one crew is running much higher than the others, the fix is often simple in theory, even if it takes work in the field: rebalance the load. That may mean reassigning labor, changing sequencing, or moving a foreman.
If utilization stays low across several crews, the problem usually starts earlier in the chain. In many cases, that points to scheduling gaps or coordination breakdowns that need attention at the planning level.
On the flip side, if utilization stays high across the board, that’s a strong sign you may need more headcount or a better crew mix before quality or safety starts to slip.
Next, measure labor cost by project to see where underused or overloaded crews are affecting margin.
5. Labor Cost by Project
What It Is and Why It Matters
Crew capacity tells you how much work your team can get done with the hours you have. Labor cost tells you what those hours are costing the job in actual dollars.
Put simply, labor cost by project shows what each job is consuming in labor spend. That means more than just hourly pay. You need to include wages, payroll taxes, workers’ comp, benefits, PTO, training, and tool burden. If you look at base wages alone, the job will look cheaper than it is.
That’s why this metric matters. It shows labor overruns while the job is still active, not after the damage is done.
The Formula
Labor Cost by Project = Σ (Hours worked on project × Fully burdened labor rate per hour)
To build the burdened hourly rate, add employer payroll taxes, workers’ compensation, benefits, and allocated overhead to the base wage. Once you do that, your labor hours turn into a dollar amount you can stack up against the estimate.
It also helps to break labor cost out by cost code, such as:
- Framing
- Rough-in
- Finish work
That way, you can see exactly where labor spend starts creeping up.
Review Cadence
Project managers should review labor cost against budget weekly, tied to payroll cycles so the numbers stay current. A weekly review makes it much easier to spot overruns before month-end.
At closeout, compare estimate versus actual by cost code. That’s where you see which parts of the job stayed on track and which ones drifted.
Management Actions It Supports
When labor cost starts running above budget, don’t treat every overrun the same. Look at the cause first. Common issues include rework, overtime, slow production, and miscoded hours. Each one points to a different fix.
If a scope change caused the overrun, that’s a change order discussion. If the same trade or phase keeps going over budget across multiple jobs, your estimating software needs work before the next bid goes out.
And if labor spend keeps climbing, rework is often the next place the overrun shows up.
6. Rework Time and Cost
When labor cost keeps climbing but the job doesn’t seem to move, rework is often the culprit.
What It Is and Why It Matters
Rework is the labor and money spent fixing work that was already done but didn’t meet spec. Think incorrect framing, misaligned HVAC runs, or failed inspections. It does not include owner-requested changes or change orders. That distinction matters. If you don’t code rework separately, those hours can look productive on paper even though they’re just undoing and redoing finished work.
Direct field rework often comes out to about 5% of project cost. Once you add delays and extended general conditions, the total hit can reach 12%.
The Formula
Track rework in two ways: as dollars and as a share of labor hours.
- Rework Labor Cost = Rework Hours × Fully Burdened Labor Rate
- Total Rework Cost = Rework Labor Cost + Rework Materials + Equipment/Subcontractor costs tied to corrections
- Rework Hours % = (Rework Labor Hours ÷ Total Labor Hours) × 100
Here’s a simple example. If a crew logs 160 hours in a week and 20 hours are coded to rework, the rework rate is 12.5%. At a $55/hour fully burdened labor rate, that’s $1,100 in labor with no forward movement on the job.
Review Cadence
Foremen should log rework daily and include the cause. Project managers should review rework hours and cost weekly, compare them against a threshold like 5%, and watch for spikes by trade or task. If the same phase keeps throwing off rework week after week, that’s not bad luck. That’s a pattern.
Management Actions It Supports
When rework goes past the threshold, don’t jump straight to blame. Start with the root cause. Design clashes, unclear direction, and workmanship problems each need a different fix.
A layout mistake that keeps showing up in framing usually points to the need for a construction quality control checklists before installation starts. Finish rework that piles up near closeout is a sign that quality checks are happening too late. In that case, checks at 50% and 90% completion make more sense than waiting for a punch list.
Every hour saved here is an hour the crew can spend moving the job ahead instead of fixing what should already be done. High rework also drags down schedule fill rate, because correction work eats up planned crew time.
That leads directly to schedule fill rate: how much of the planned crew time is actually getting filled with work.
7. Schedule Fill Rate
What It Is and Why It Matters
Schedule fill rate is the share of available crew hours that are booked to productive work during a set time period. Here’s a simple example: if your 15-person crew has 600 available hours next week, but only 480 of those hours are assigned to active tasks, your schedule fill rate is 80%.
This metric looks ahead. Billable hours tell you what already happened. Schedule fill rate tells you whether next week’s labor time is lined up and ready to go. Put simply, it’s the planning-side match to the labor metrics above.
A lot of contractors aim for 85%–95%. If you’re below 75%–80%, too much crew time is sitting unassigned. If you’re above 95%, you may be packing the schedule too tight.
The Formula
You can track this by crew, trade, or project. That makes it easier to spot where the schedule starts slipping.
Schedule Fill Rate (%) = (Total Scheduled Crew-Hours ÷ Total Available Crew-Hours) × 100
Say you have 3 crews with 15 workers total, and each person is set for a standard 40-hour week. That gives you 600 available crew-hours. If the schedule only includes 480 hours of assigned work, your weekly fill rate is:
480 ÷ 600 × 100 = 80%
You can also break the number down by crew, trade, or project to see exactly where the open gaps are piling up.
Review Cadence
Foremen and superintendents should check the next day’s load every day. Project managers should review the next one to three weeks each week, watching for light periods where work can be pulled ahead or heavy stretches where tasks need to be spread out. Owners and senior managers should track fill rate each month, or on a rolling 4- to 8-week basis, to help with hiring decisions, subcontractor use, and project start timing.
Management Actions It Supports
When fill rate drops below target, look for work you can pull forward. That might include approved change orders, punch list items, or small repair and maintenance jobs where materials and permits are already ready. You can also resequence tasks across projects. If one job is stuck waiting on an inspection, move crew time to a project that’s ready to go. Slow periods can also be used for maintenance.
When fill rate stays above 95%, shift noncritical tasks into later weeks, bring in subcontractors during peak periods, or stagger project start dates when you can. A schedule that stays overbooked tends to push work, force resequencing, or create a need for subcontractor help.
Viewed alongside the other six metrics, fill rate shows whether the schedule lines up with field demand.
How the 7 Metrics Work Together
On its own, each metric tells you something useful. Put them together, and you can see where the job is starting to jam up. Crew utilization works best when you treat it like a group of connected signals, not a stack of separate KPIs. The real clue is in how those numbers move together.
When crew capacity stays above 90% for several weeks, overtime usually climbs first. After that, rework tends to show up as fatigue starts dragging down quality.
Here’s a clear example: 95% fill rate, 20% overtime, 92% capacity utilization, and labor cost 12% over forecast. On paper, the schedule looks full. In practice, margin is already starting to slip.
It gets a lot easier to act on these numbers when you tie them to an actual field issue. This table shows how common metric combinations point to likely jobsite problems and what to do next.
| Metric Combination | Signal | Next Step |
|---|---|---|
| High fill rate + high idle time + low billable utilization | Crews are booked but blocked by materials or sequencing | Fix procurement and task sequencing, not the calendar |
| High overtime + rising rework + labor cost over budget | Fatigue is driving mistakes and margin loss | Reduce overtime, add temporary labor, review recent workmanship |
| High capacity utilization + flat billable hours | Hours are maxed out without more billable output | Audit how hours are spent; identify non-value tasks |
| Low fill rate + low idle time + strong billable utilization | Healthy load with room to add work | Pull forward approved tasks or stage next project earlier |
Don’t try to tune one metric by itself. The goal isn’t perfect scores. The goal is to spot repeat patterns before they turn into overruns.
The next step is getting these combinations into one system, so the trends show up before the overruns do.
Using Construction Software to Track Crew Utilization
The fastest way to act on these signals is to keep them in one system. Integrated construction software puts timecards, schedules, and job costs in the same place, so utilization data stays current. That means the seven metrics update as crews work, not days later after the week closes.
The big win is source-coded time. Field teams assign hours once, and that same data carries through payroll, job costing, and utilization reports without extra entry. In plain English: no copying numbers from one file to another, and no end-of-week scramble to clean up timecards.
From there, the software turns field entries into the reports contractors use every day. Contractor Foreman connects digital timecards, daily logs, scheduling, and job cost codes in one dashboard for billable hours, overtime, labor cost, and rework. Its QuickBooks integration keeps job cost data lined up with financial reporting.
That gives project managers one dashboard for overtime, crew capacity, and schedule fill rate instead of piecing the numbers together from separate files. It’s a much simpler way to catch the patterns from the prior section before they turn into overruns.
Conclusion
Track a small set of labor metrics on a steady schedule. Review them at the same time each week or month. When the data is clean, these seven metrics make it much easier to spot where labor is moving the job forward – and where it’s slowing things down.
Each metric answers its own question. Put them together, and they tell one clear story: whether crews are productive, balanced, and staying on budget with construction budgeting software.
That only matters if the team does something with the numbers. Standardize time codes, stick to a set review cadence, and leave each review with one clear action.
FAQs
Which crew utilization metric should I track first?
If you’re starting from scratch, begin with shift productivity, crew hours, and task completion rates. These metrics give you a clear baseline for how your team is performing and make it easier to spot where changes may help.
As you move forward, put extra focus on labor utilization rates. Compare billable hours to total hours worked so you can keep your crew productive and protect profit.
What is a good target range for each metric?
Use these benchmark ranges to gauge crew utilization:
- Billable utilization: 80%–85%. If it drops below 75%, you may be paying for too much non-billable time.
- Shift utilization: 85%–90%.
- Schedule: SPI above 1.0, with schedule adherence above 95%.
- Financials: budget variance at 5% or less, and CPI above 1.0.
- Equipment utilization: above 80% to cut idle time.
How can I improve crew utilization without causing burnout?
Improve crew use by focusing on efficient planning and clear communication, not just adding more hours. The goal is to match staffing to actual output needs, assign work based on each person’s skills, and avoid overstaffing or extra trips caused by bad communication.
Support crews with a few simple habits that make the day run smoother:
- Shift-swap flexibility when schedules change
- Real-time updates from the field
- Morning huddles to line up the day’s work
- Regular training and coaching to keep teams engaged and tied to project goals
When those pieces are in place, crews spend less time waiting around and more time doing the work that moves the job forward.
Related Blog Posts
- How Workforce Data Improves Construction Outcomes
- Real Data That Drives Residential Construction Decisions
- Shift Productivity Metrics for Construction Teams
- Construction Productivity Benchmarks by Job Type