- 1. Real-Time Data and Live Sync
- 2. KPI Tracking for Cost, Schedule, and Quality
- 3. Visual Progress Tracking and Schedule Health
- 4. Budget and Cash Flow Visibility
- 5. Field Data from Daily Logs and Timecards
- 6. Customizable Views and Role-Based Dashboards
- 7. Issue, Risk, and Change Order Tracking
- 8. Mobile Access for On-Site Use
- 9. Integration with Core Construction Systems
- 10. Security, Permissions, and Data Access Controls
- Conclusion
- FAQs
The best construction dashboards don’t feel like another software or another “tool” in your toolbox.
They feel like a ridiculously organized, hyper-competent assistant—part Jarvis from Iron Man, part Hermione Granger with a clipboard. The kind that knows what’s happening across your projects 24/7, alerts you when something needs attention, and has the answer ready before you even ask the question.
Nope, that’s not asking too much. That’s what construction dashboards should do!
Because if you’re still digging through reports and second-guessing your data, your dashboard isn’t acutally doing its job, is it?
A good dashboard makes your life 10x easier—not give you one more thing to think about.
Now the question is: what does that actually look like?
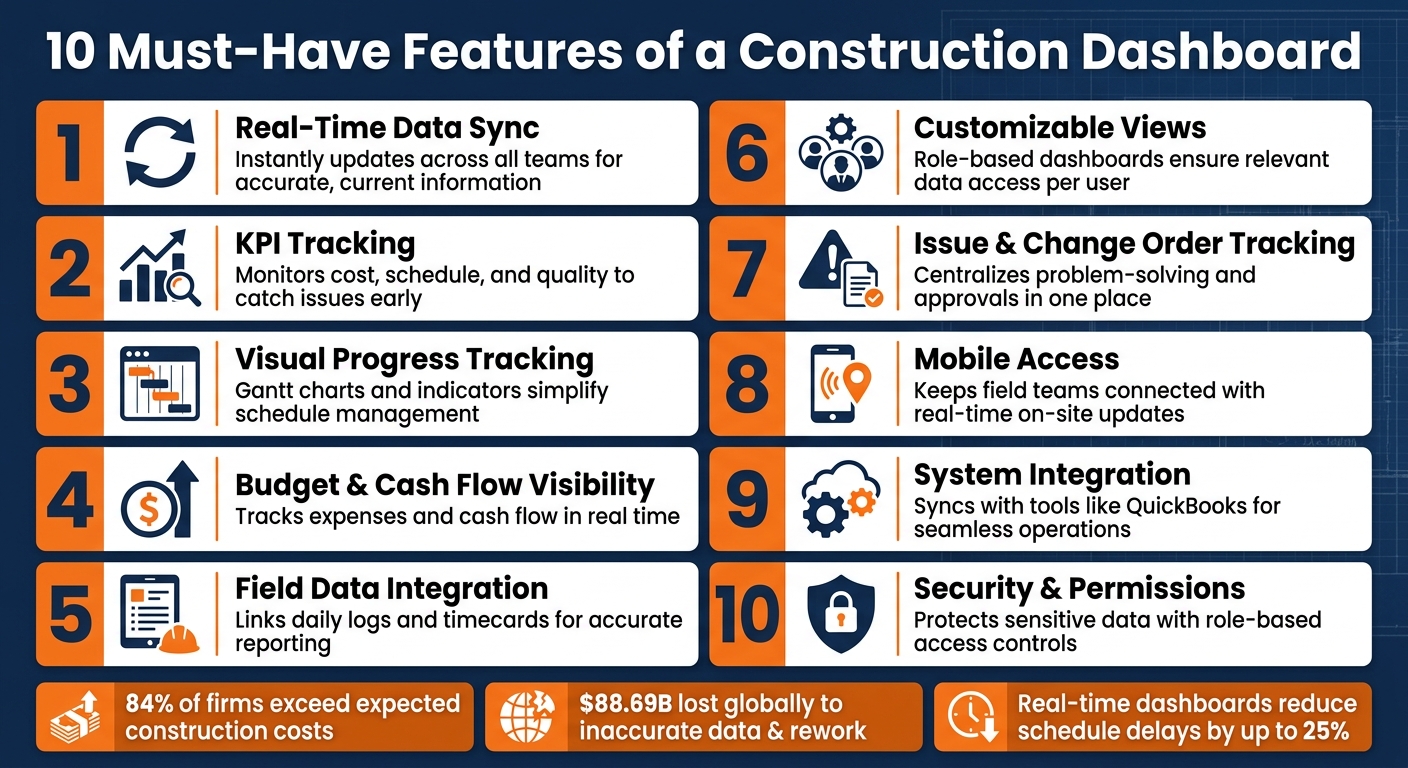
Here are 10 features every construction dashboard should have:
- Real-Time Data Sync: Updates instantly across teams for accurate, current information.
- KPI Tracking: Monitors cost, schedule, and quality to identify issues early.
- Visual Progress Tracking: Tools like Gantt charts simplify schedule management.
- Budget & Cash Flow Visibility: Tracks expenses and cash flow in real time.
- Field Data Integration: Links daily logs and timecards for accurate reporting.
- Customizable Views: Role-based dashboards ensure relevant data access.
- Issue & Change Order Tracking: Centralizes problem-solving and approvals.
- Mobile Access: Keeps field teams connected with real-time updates.
- System Integration: Syncs with tools like QuickBooks for seamless operations.
- Security & Permissions: Protects sensitive data with role-based access controls.
These features are essential for managing costs, schedules, and risks while ensuring smooth collaboration between office and field teams. Tools like Contractor Foreman offer these functionalities starting at $49/month, making them accessible for construction professionals.
10 Must-Have Features of a Construction Dashboard
1. Real-Time Data and Live Sync
On a busy job site, there’s no time to wait for end-of-day updates. If a subcontractor makes a change on-site, the project manager at the office needs to know immediately. Real-time data and live syncing ensure everyone has access to the latest information, creating the foundation for smooth, responsive project management.
When field teams log work hours, update tasks, or flag issues, that information instantly updates in the central dashboard. This allows office staff to keep schedules on track and helps project managers catch budget discrepancies before they spiral. As Contractor Foreman explains: “Enter your data once and let it sync across your other systems.”
Keeping budgets in check is another major advantage. 84% of firms report exceeding expected construction costs. Without live budget tracking, these overruns often go unnoticed until it’s too late to make adjustments.
Live syncing also eliminates the data silos that often slow teams down. A platform that integrates seamlessly with accounting tools like QuickBooks ensures financial reports are always up to date. Chuck A. from Liercke Construction, LLC, highlights the value of this integration:
“The integration of the whole platform is very good, including externally with QuickBooks Online. Ability to do time sheets in the field without separate software. Cost codes and cost items that can be used for different jobs, this is huge for us.”
Without live syncing, dashboards rely on outdated information, leaving teams without a dependable source of truth. This feature is a must-have for any construction management system to function effectively.
sbb-itb-5eea312
2. KPI Tracking for Cost, Schedule, and Quality
Real-time data only holds value if you’re monitoring the right KPIs. A construction dashboard highlights KPIs that reveal project health, giving teams the chance to address issues before they spiral into expensive problems. These KPIs act as the bridge between raw data and actionable decisions.
Focus on three key areas: cost, schedule, and quality. For cost, this means keeping an eye on budget variance, committed costs, and forecast at completion. On the schedule side, metrics like the Schedule Performance Index (SPI), schedule variance, and compression (how much work is being crammed into less time) serve as early red flags. For quality, inspection pass rates and rework costs provide clear indicators of performance.
A critical feature of a dashboard is its ability to differentiate between lagging and leading indicators. Lagging indicators, such as tasks completed last week, show what’s already occurred. Leading indicators, like declining project float or reduced labor productivity, predict what’s about to happen. According to a McKinsey study, capital projects experience average cost overruns of 79% and schedule delays of 52% compared to initial estimates. These overruns don’t happen all at once – they build up gradually. The right KPIs can detect these trends early, aligning perfectly with the dashboard’s role as a proactive early-warning system.
“The projects that finish on time and on budget are rarely the ones that got lucky. They are the ones where someone was watching the right signals, early enough to act on them.” – Civiconcepts
To make your dashboard even more effective, set variance thresholds that trigger automatic alerts. For instance, a profit fade exceeding 2% might prompt a conversation with the project manager, while anything over 5% could require leadership intervention. These thresholds ensure that problems are addressed before they escalate, transforming your dashboard from a simple reporting tool into a dynamic system for staying ahead of potential issues.
3. Visual Progress Tracking and Schedule Health
Raw data on its own can leave project managers scrambling to piece together on-site progress. Tools like Gantt charts and progress indicators simplify this process by turning complex schedule data into an easy-to-read visual format. This clarity makes it much easier to spot scheduling risks at a glance.
One of the biggest benefits of these tools is their ability to identify schedule compression before it becomes a serious issue. When a project falls behind but still aims to meet a fixed end date, the resulting compression often leads to crew stacking, bottlenecks, and increased safety risks. Visual dashboards can flag this risk early by highlighting the gap between the predicted completion date (based on current progress) and the scheduled completion date.
Real-time data accuracy takes these tools further by enabling the tracking of key visual metrics, such as the Schedule Performance Index (SPI) slope. A single SPI reading below 1.0 signals you’re behind schedule, but a declining trend over time indicates the problem is worsening and needs immediate action. Similarly, monitoring float erosion can reveal when buffer time is being used up faster than expected, often before anyone raises concerns. Studies show that implementing real-time dashboards can cut schedule delays by as much as 25% by catching bottlenecks early.
Failing to use visual progress tracking can lead to costly mistakes. For example, a case study from AACE International examined a $27.97 million construction project that lost its project controls oversight midway through execution. Without real-time tracking, performance issues went unnoticed until the sixth month of a ten-month schedule. By then, only one month of a seven-month delay could be recovered, resulting in a $9.27 million cost overrun – ten times the original project controls budget.
“The schedule should be continually monitored to reveal when forecasted completion dates differ from baseline dates, and whether schedule variances will affect downstream work.” – GAO’s Schedule Assessment Guide
However, even the best dashboards are only as good as the schedule they rely on. If the schedule has broken logic or missing predecessors, the float and risk data it generates will be unreliable. Ensuring the schedule’s integrity is critical for accurate visual reporting.
4. Budget and Cash Flow Visibility
Keeping a construction project on track isn’t just about meeting deadlines – it’s also about keeping finances in check. A construction dashboard helps you do just that by offering real-time insights into budgets, expenses, and cash flow. With everything displayed in USD across active jobs, you can see the full financial picture at a glance.
Financial visibility is just as important as tracking project metrics. It’s not enough to know you’re making a profit on paper; you also need to ensure you have cash available to meet immediate obligations. Dan Cumberland of Dan Cumberland Labs puts it perfectly:
“The 13-week forecast separates ‘are we making money’ (WIP, Job Profitability) from ‘do we have money on hand’ (Cash Flow). Both matter. Only one keeps the lights on Friday.”
A 13-week rolling cash flow view provides an essential breakdown of all inflows and outflows. This includes progress billings, retainage releases, payroll, subcontractor payments, materials, and insurance. Such visibility is critical when the average Days Sales Outstanding (DSO) stretches to 83 days. With this kind of clarity, you can better manage ongoing financial metrics and make informed decisions.
In addition to cash flow, real-time Work in Progress (WIP) data adds another layer of financial insight. For instance, consistent underbilling signals that revenue has been earned but not yet invoiced, leaving you to finance the project with your own funds. On the other hand, overbilling can create an illusion of healthy working capital while hiding potential financial risks. By monitoring these trends weekly, you can act quickly to address issues before they escalate.
To stay ahead, consider using color-coded thresholds for job cost variance alerts. For example, a variance above 2% might trigger a discussion with the project manager, while anything over 5% could require leadership intervention.
Tools like Contractor Foreman simplify financial oversight by integrating with QuickBooks. They consolidate cost codes, estimates, change orders, invoices, and expenses into one streamlined system. As Chuck A. of Liercke Construction, LLC shares:
“The integration of the whole platform is very good… Cost codes and cost items that can be used for different jobs, this is huge for us.”
These kinds of financial controls ensure your dashboard is not just a tool for tracking but a powerful resource for proactive construction management.
5. Field Data from Daily Logs and Timecards
Financial metrics might steer project budgets, but field data from daily logs and timecards provides the real-world details needed for a well-rounded project dashboard. To truly understand a project’s health, your dashboard has to reflect what’s happening on-site. This level of visibility ensures smoother integration with cost tracking systems.
It’s no surprise that 62.4% of construction companies now use mobile devices for field reporting. These tools bridge the gap between on-site operations and the office, offering a clearer view of progress. For example, linking timecards to two-tier cost codes automates the process of updating payroll and job costs, cutting out manual data entry.
Matthew S. from M. Smith Contracting explains the value of this system:
“The time tracking software for my crew allows me to keep track of all my crew’s hours and where they are and what they are doing. This helps on jobs where I can cross reference their productivity on linear foot of wall and square foot of wall completed per hour.”
But it’s not just about tracking labor. Daily logs also capture other critical on-site factors like material deliveries, equipment usage, safety incidents, and schedule disruptions. For instance, if a weather delay occurs, timestamped data in the logs can prompt immediate adjustments, such as reassigning crews. This real-time synchronization allows the office to make quick decisions, which is vital given that nearly 70% of tradespeople identify poor schedule management as the leading cause of lost labor productivity.
Tools like Contractor Foreman streamline this process by integrating GPS-based timecards, daily logs, and cost code tracking. This ensures that field data flows directly into the project’s financial systems.
6. Customizable Views and Role-Based Dashboards
Customizable views are the key to making sure every team member has access to the data that’s most relevant to their role.
Think about it: executives need a big-picture overview of financials and risks, project managers need detailed insights into budgets and schedules, and field workers need to focus on daily logs, timecards, and safety updates. A generic, one-size-fits-all dashboard just doesn’t cut it – it can lead to confusion and even increase costs.
By tailoring access, decision-making becomes faster, and errors are less likely.
Role-based dashboards are designed to address this need, customizing data access for different functions. Field staff can view only the projects they’re involved in, managers can restrict sensitive financial details like payroll and profit margins to authorized individuals, and clients can access contractor apps with client portals that provides progress updates and detailed expense breakdowns. This level of precision doesn’t just streamline workflows – it also sets the stage for even more visual customization.
On top of tailored access, the most effective dashboards allow users to adjust how they view their data. Whether you prefer Kanban boards, Gantt charts, lists, or calendars, the flexibility to switch between these formats makes it easier to work the way you want. Features like sticky filters and drag-and-drop columns save time by eliminating repetitive setups, so teams can stay focused on the insights that matter most.
As Contractor Foreman explains:
“Custom reports are like tailor-made suits – they perfectly fit your specific needs. Unlike generic, one-size-fits-all reports, custom reports provide directly relevant insights to your project.”
Contractor Foreman enhances this experience with tools like custom fields, role-based permissions, and the ability to tailor views by project or responsibility. This ensures that every user, from executives to field staff, sees only the information they need to do their job effectively.
7. Issue, Risk, and Change Order Tracking
When problems pop up on a job site, a quick response can make all the difference. That’s where a centralized dashboard comes in – it keeps all open issues, active risks, and pending change orders in one place. This setup eliminates the need to sift through endless email threads or chase down missing paperwork. Plus, it lays the groundwork for using visual tools like Kanban boards to quickly assess and tackle problems.
By bringing everything together in real time, the dashboard ensures your team is always working with accurate, up-to-date information. No more delays caused by scattered data.
Kanban-style views are particularly handy because they let managers organize issues, RFIs, and change orders by status – like Pending, Approved, or Waiting on Client. This makes it easy to spot bottlenecks and identify who’s responsible for resolving them. Even better, when a change order gets approved, the dashboard can automatically adjust the total contract amount and update job costing reports, cutting down on manual data entry and reducing mistakes.
Client portals add another layer of efficiency. They allow stakeholders to review and sign off on change orders or respond to RFIs directly. Every interaction is automatically logged, creating a clear and reliable paper trail. Tools like Contractor Foreman simplify this further with features like electronic approval options, custom fields for tracking codes or signatures, and the ability to turn Change Order Requests (CORs) into finalized Change Orders with just one click.
Documenting risks is just as important. Features like schedule notices and compliance tracking let contractors record delays caused by things like bad weather, subcontractor issues, or material shortages. These records can be critical for protecting against future liability disputes.
“This software packs more punch than you would expect at its meager price point. It offers so much in the way of construction management that it is almost unbelievable.” – Lindsey-Leigh M., JWH Construction Services, Inc
8. Mobile Access for On-Site Use
A dashboard that’s tied to a desk isn’t practical for construction teams. Field crews and project managers need real-time updates on-site, just like office staff do. That’s why mobile access isn’t just a nice-to-have – it’s essential. With mobile functionality, project data stays up-to-date no matter where your team is working.
The need for this is clear. According to Contractor Foreman, 75% of construction firms have reported a growing demand for faster decision-making in the field. Delaying field data entry or relying on memory leads to mistakes. In fact, inaccurate data and reporting account for 14% of all construction rework, costing an estimated $88.69 billion globally. Mobile data entry on-site helps avoid these costly errors.
The best mobile dashboards don’t cut corners. They offer the same robust tools as their web counterparts: daily logs, GPS-enabled timecards, photo capture and markup, plan viewing, and even in-person payment processing.
Chuck A. of Liercke Construction, LLC highlights this:
“Contractor Foreman’s mobile app delivers the full range of features – daily logs, GPS-enabled timecards, photo capture, and more – ensuring that field operations are as robust as the web platform.”
With GPS clock-ins, photo attachments to punchlist items, and real-time task updates from the field, communication gaps disappear, and data accuracy improves. Changes made on-site are instantly visible in the office.
Contractor Foreman’s mobile app covers all these features, starting at $49/month, and boasts a 4.3/5 rating on Google Play from 888 reviews as of May 2026. Available for both phones and tablets, it gives teams the flexibility to stay connected wherever the job takes them. This level of mobile integration is key to a fully connected construction dashboard.
9. Integration with Core Construction Systems
The effectiveness of a dashboard hinges on how well it connects to your essential tools. If your project management software doesn’t communicate with your accounting or scheduling systems, you’re stuck re-entering the same data multiple times – a recipe for errors. By integrating your dashboard with core construction systems, you can eliminate these inefficiencies entirely.
With real-time updates and field data capture, integration ensures your dashboard serves as a reliable single source of truth. For most contractors, top construction accounting software integration is the top priority. Automatically syncing invoices, payments, and line items with QuickBooks Online keeps financial records accurate without the need for manual data entry. Built-in error handling further reduces the risk of duplicate entries. Anthony W. from Authority Refrigeration, LLC highlights this benefit:
“The ability to, in one place, track jobs from estimating, to project progress, billing, and employee management all in one place that also integrates with QuickBooks.”
Scheduling integration is another key aspect. Linking with Microsoft Project allows teams to quickly import and export detailed schedules, avoiding the hassle of manual updates or mismatched versions. Two-way syncing with Google Calendar and Outlook 365 ensures that both field crews and office staff stay aligned effortlessly. For field documentation, tools like CompanyCam can automatically sync site photos into project files, while Gusto simplifies payroll by transferring GPS-verified timecards directly.
Contractor Foreman takes integration to the next level, connecting with over 50 systems, including tools for accounting, scheduling, payroll, payments, and estimating. It also uses Zapier to fill gaps where native integrations aren’t available. Pricing starts at $125/month for plans with QuickBooks Online integration, with the full suite available for $249/month for unlimited users. However, it’s worth noting that support for QuickBooks Desktop ended on January 1, 2026, so teams still using the desktop version will need to switch to QuickBooks Online to maintain compatibility.
This level of integration not only streamlines operations but also sets the stage for robust project management – an essential component of any effective construction dashboard.
10. Security, Permissions, and Data Access Controls
When managing construction projects, controlling who can see and do what is crucial. For instance, a subcontractor working on-site doesn’t need access to profit margins, and a client reviewing progress photos shouldn’t have the ability to edit your budget. A well-designed construction dashboard allows you to set these boundaries, ensuring users only access the information relevant to their role.
Role-Based Access Control (RBAC) plays a key role here. By tailoring access to specific modules, you can protect sensitive information while streamlining workflows. For example, you can restrict employees to viewing data only for the projects they’re assigned to, or set certain modules to “No Access”, hiding them entirely.
As Contractor Foreman explains:
“Make your employees’ lives easier and help them start using Contractor Foreman faster by setting limits on what they can see and do.”
Audit logs provide another layer of security by tracking every change made – who made it, when, and even where they were located. This level of accountability is especially useful when unexpected changes occur. Additionally, geofencing adds further precision by limiting clock-ins to specific GPS locations, eliminating “buddy punching” and ensuring accurate time tracking.
Beyond user-level controls, the platform’s infrastructure strengthens security even more. Contractor Foreman operates on AWS, with encrypted data transfers and two daily off-site backups. This setup guarantees 99.9% uptime, starting at $49/month. Considering that the global average cost of a data breach reached $4.45 million in 2023 – and each compromised record in construction costs about $164 – tight access controls aren’t just about protecting data; they’re also a financial safeguard.
Conclusion
The true power of a dashboard lies in how its features come together. When tools like real-time data, KPI tracking, budget insights, field logs, and role-based access are unified, you move from simply reacting to challenges to actively preventing them before they arise.
This combination of features not only improves efficiency but also reduces risks with tangible financial impacts. Consider this: around 14% of construction rework – equating to roughly $88.69 billion globally – results from inaccurate data. Additionally, 75% of firms emphasize the need for quick decision-making in the field. Fragmented dashboards can lead to costly mistakes.
Contractor Foreman addresses these challenges by bringing all essential dashboard functions into one platform. With more than 35 features, including project management tools, financial tracking, GPS-based timecards, daily logs, client portals, and QuickBooks integration, it covers all 10 critical dashboard necessities. Lindsey-Leigh M. from JWH Construction Services, Inc. shared:
“This software packs more punch than you would expect at its meager price point. It offers so much in the way of construction management that it is almost unbelievable.”
These features make a strong case for adopting a centralized, all-in-one dashboard solution.
Plans start at just $49/month, including a 30-day free trial and a 100-day money-back guarantee – plus a Price Lock to secure your rate. Visit Contractor Foreman to gain better control over your project costs, schedules, and field operations.
FAQs
Which KPIs matter most on a construction dashboard?
When it comes to managing construction projects, the most important KPIs revolve around financial health, schedule performance, labor productivity, safety, and quality. Some of the key metrics to track include:
- Cost variance: Keeps tabs on how actual costs compare to the budget.
- Budget usage: Measures how much of the allocated budget has been spent.
- Schedule variance: Tracks whether your project is ahead, behind, or on schedule.
- Completion percentage: Shows how much of the project has been finished.
- Output per crew hour: Evaluates labor efficiency by measuring productivity.
- Incident rates: Monitors workplace safety by tracking accidents or injuries.
- Defect rates: Assesses the quality of work by identifying errors or rework needed.
With tools like Contractor Foreman, you can customize these metrics to align with your business goals, ensuring your team stays focused on what matters most.
How do I set alert thresholds for cost and schedule variance?
Contractor Foreman makes it easy to manage cost and schedule variances with its automated variance analysis tools. You can set percentage-based thresholds – like a 10% budget overrun – to trigger real-time alerts. These alerts are designed to catch potential cost overruns or delays early, giving you the chance to address issues before they escalate.
To fine-tune these alerts, use the platform’s notification and reporting settings. This ensures your team stays informed and aligned, helping everyone respond quickly to changes and keep the project on track.
What should I integrate first: accounting, payroll, or scheduling?
When building your dashboard, focus on incorporating tools for time tracking, purchase orders, and payroll to get a real-time overview of your project budget. Start with accounting platforms like QuickBooks, which streamline tasks such as invoicing, payroll, and expense tracking. This not only reduces manual errors but also delivers precise, immediate insights into your project costs and budget performance – essential for staying profitable and making smart decisions.