
Gandhi once said, “There is more to life than increasing its speed.”
Well clearly, Gandhi never had to explain to a homeowner why six guys were onsite all day but somehow only one wall got painted.
Because in construction, productivity matters – A LOT!
Labor already eats up a huge portion of project costs — often anywhere from 20% to 40% of the entire budget — so when crews lose time to delays, poor coordination, missing materials, rework, or endless “quick supply runs,” your profit margin starts taking punches immediately.
And the frustrating part is most productivity problems don’t look dramatic in real time. The crew looks productive. Trucks are moving. Tools are making noise. Everybody has that intensely focused face like they’re deeply involved in something important that you’re shy to bother them for even a second.
But then…you’re three days late. One week late. Two weeks late!
UGH!
Now before you fire the entire crew and start a one-man construction company out of pure rage, consider this:
They’re probably not trying to cheat you or be lazy.
Most productivity problems happen because expectations aren’t crystal clear, priorities keep changing, or there’s simply no system keeping everybody accountable.
Want to improve construction productivity?
Tracking shift productivity metrics is the way to go. It helps you spot delays earlier, reduce downtime, keep crews accountable, and avoid paying six people to stand around.
Key Metrics to Watch:
- Labor Productivity Per Shift: Measures work completed per labor hour.
- Shift Utilization Rate: Tracks productive time vs. idle time during shifts.
- Schedule Adherence: Compares planned hours to actual hours worked.
These metrics provide real-time insights into where resources are wasted, helping you make faster decisions to keep projects on track. Tools like GPS-enabled timecards and mobile apps make it easier than ever to collect and analyze this data. Ready to boost productivity? Let’s dive in.
Main Shift Productivity Metrics to Track
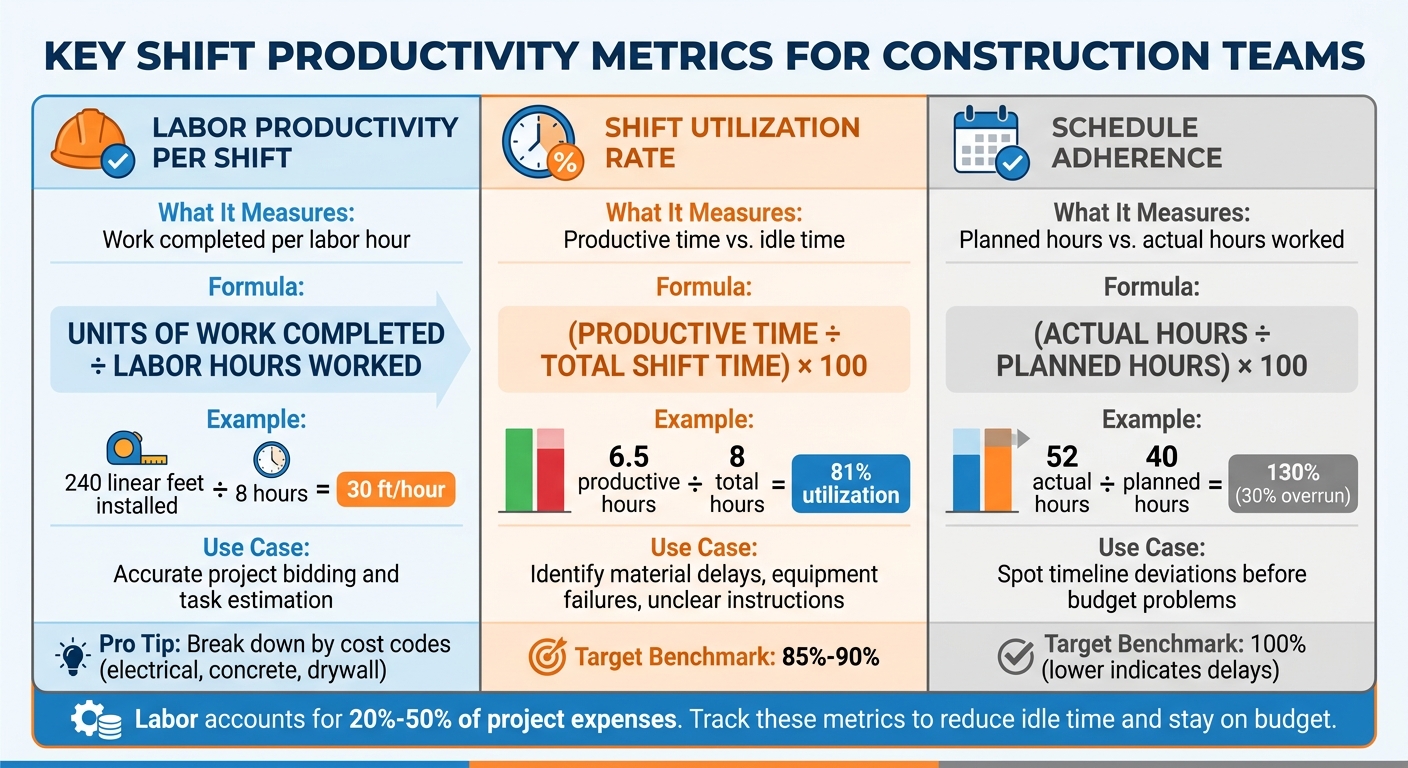
Construction Shift Productivity Metrics Comparison Table with Formulas and Benchmarks
Labor Productivity Per Shift
Labor productivity per shift measures how much work your team completes compared to the hours they put in.
The formula:
Units of Work Completed ÷ Labor Hours Worked
For example, if a framing crew installs 240 linear feet of wall during an 8-hour shift, they’re achieving 30 linear feet per labor hour.
This metric is a key tool for accurate project bidding since it provides concrete data on the actual time needed for specific tasks. For even more detailed insights, break down shifts by cost codes – like electrical, concrete, or drywall – to understand how labor is distributed.
Next, let’s look at how effectively time is being used by focusing on shift utilization.
Shift Utilization Rate
Shift utilization rate measures the percentage of time workers spend on productive, billable tasks versus idle time.
The formula:
(Productive Time ÷ Total Shift Time) × 100
For instance, if your team works an 8-hour shift but spends 1 hour waiting for materials and 0.5 hours on extended breaks, they log around 6.5 productive hours. This results in a utilization rate of about 81%.
A high utilization rate shows efficient resource use, while a lower rate might highlight issues like material delays, equipment failures, or unclear instructions.
Now, let’s evaluate how well planned hours align with actual hours worked.
Schedule Adherence: Planned vs. Actual Hours
Schedule adherence tracks how the hours you originally budgeted for a task compare to the actual time spent. For example, if you budget 40 hours for a concrete pour but the task takes 52 hours, that 30% overrun is a red flag that needs immediate attention.
Regularly monitoring this metric helps you spot timeline deviations before they cause bigger budget problems.
Reviewing planned versus actual hours can quickly reveal where productivity is slipping. If overruns are frequent, it may be time to adjust – whether that’s resizing crews, offering more training, or fine-tuning workflows – to keep projects running smoothly. Together, these metrics provide the insights needed to make informed decisions and optimize resources across your projects.
sbb-itb-5eea312
How to Calculate and Track Shift Productivity Metrics
Defining Inputs and Outputs for Shifts
To measure productivity effectively, you need clear definitions of inputs and outputs for each shift. Inputs refer to the resources consumed, such as labor hours, equipment usage, materials, and indirect costs. Outputs are the measurable results, like linear feet installed, cubic yards poured, or square feet completed.
For labor inputs, use digital time cards to track total man-hours worked per shift. Equipment inputs can be recorded through logs that capture machine hours, fuel usage, and operator details. On the output side, maintain daily logs to document completed tasks, units of work finished, and progress updates. Don’t forget to include safety metrics, such as incident reports and inspection checklists.
| Category | Key Inputs (Data to Collect) | Key Outputs (Results to Measure) |
|---|---|---|
| Labor | Total man-hours, crew size, trade specializations | Tasks completed, earned hours, labor cost per unit |
| Equipment | Machine hours, fuel consumption, operator IDs | Units moved/installed, equipment uptime |
| Project Management | Planned work orders, RFI responses | Daily log updates, percentage of shift goal met |
| Safety/Admin | Safety meeting attendance, permit status | Incident reports, completed inspection checklists |
Once you’ve defined these inputs and outputs, you can apply standard formulas to calculate productivity metrics.
Formulas for Common Metrics
Here’s how to use formulas to assess performance:
- Labor Productivity: Divide the installed quantity by the total labor hours.
- Earned Hours: Multiply the actual quantities installed by the budgeted hours per unit.
- Productivity Variance (or Productivity Factor): Compare earned hours to actual hours. A factor of 1.0 means you’re on track; above 1.0 indicates you’re ahead of schedule.
- Schedule Performance Index (SPI): Measure timeline adherence by dividing earned value by planned value.
- To forecast remaining work, divide the remaining quantities by your current actual productivity rate.
Using these formulas allows you to make real-time adjustments, keeping shift performance aligned with project goals. It’s also important to account for field efficiency – typically 80%–90% under normal conditions, but this can drop to 70%–80% during overtime or bad weather. For an 8-hour shift, plan for 7 to 7.5 productive hours, factoring in breaks and transitions.
Tracking Frequency and Data Collection
Consistent tracking is key to identifying inefficiencies early. Use mobile apps to capture all shift data before the day ends. Standardized daily log templates ensure you can compare shifts easily.
- Daily tracking: Helps you spot problems in real-time.
- Weekly reviews: Highlight trends, such as crew performance and cost code status. If your labor burn rate (percentage of hours used) surpasses your production progress (percentage of work completed), you risk budget overruns.
- Monthly analysis: Offers a broader view, helping you forecast and assess overall project health.
This layered approach – daily data capture, weekly trend analysis, and monthly strategic reviews – keeps your project on track and helps you address inefficiencies before they impact your margins.
Tools for Measuring Shift Productivity
Tool #1: Using Contractor Foreman for Productivity Tracking
Contractor Foreman provides a centralized platform designed to track shift performance, bridging the gap between the field and the office.
One standout feature is its GPS-enabled timecards, which verify crew locations and help prevent time theft. When foremen clock in through the mobile app, the system captures their location and timestamp, ensuring labor hours are recorded accurately and transparently.
The platform’s daily logs module tracks shift details in real time, recording everything from weather delays to material shortages. This immediate data capture helps identify inefficiencies as they occur. Additionally, tools like Gantt charts and Kanban boards give a clear picture of task progress by showing completion percentages and highlighting the critical path.
Contractor Foreman also connects labor data directly to construction cost calculations through its financial dashboard.
By comparing actual hours from GPS-verified timecards to budgeted hours, contractors can identify cost overruns early by improving the accuracy of construction cost estimates and address them before they escalate. The software is compatible with iOS and Android devices and even works offline, making it practical for remote jobsites. With pricing starting at $49/month and a 30-day free trial, it’s an accessible option for small to medium-sized contractors who need effective tracking without unnecessary complexity. The integration of mobile apps further enhances the ability to monitor productivity in real time.
Tool #2: Using Mobile Apps for Real-Time Data
Mobile apps allow for same-day productivity analysis, cutting out delays caused by weekly reporting. Advanced features like AI-powered facial recognition, biometrics, and geo-fencing prevent fraudulent practices like “buddy punching”, an issue that affects 75% of companies and leads to financial losses.
For example, ABLe Communications adopted mobile timesheets that required foremen to record accurate crew hours and assign proper cost codes daily. This change resulted in what Brandon Lopez, Chief Operations Officer – VP of Production, described as “immeasurable improvement in accuracy of labor data”.
These mobile tools can link verified labor hours to installed quantities – such as linear feet of conduit or cubic yards of concrete – and assign them to specific cost codes. This integration allows for automatic calculation of the Productivity Factor (Earned Hours ÷ Actual Hours), showing whether a crew is ahead of or behind schedule. Additional features like one-click cost code assignment, photo uploads for daily logs, and LTE-enabled dashboards provide project managers with immediate insights into labor deployment and productivity metrics. This level of real-time visibility helps ensure projects stay on track and within budget.
Analyzing and Improving Shift Performance
Identifying Trends and Variances in Metrics
Real-time digital logs and time cards are game changers when it comes to spotting inefficiencies. They provide instant data on labor hours and completed work, so you’re not stuck waiting until problems snowball into bigger issues. By keeping an eye on real-time costs, you can quickly pinpoint differences between estimated and actual shift expenses.
Centralized reporting makes it easier to see the bigger picture. It pulls together shift data to highlight underperforming crews and recurring issues with schedule adherence. For example, if one shift consistently runs over its planned hours, that’s a clear sign of a systemic issue worth investigating. Instead of guessing, you’ll have hard data to identify bottlenecks.
Don’t forget to include equipment logs in your analysis. Reviewing vehicle and equipment logs alongside shift data can uncover whether equipment downtime is eating into productivity. These costs can add up fast if they’re not tracked and addressed.
With these insights, you can start comparing crew performance across shifts more effectively.
Comparing Crew Performance Across Shifts
Once you’ve analyzed trends, standardizing how you compare shifts can take your evaluations to the next level. Use a consistent productivity formula, like Output ÷ Input, across all shifts to ensure fair comparisons. Break projects into specific tasks using cost codes – such as framing, electrical, or plumbing – so you’re comparing similar work rather than unrelated activities.
“High labor productivity does not mean workers move faster at unsafe speeds. Instead, it means workers spend more time on value-adding tasks and less time waiting, reworking, or searching for materials.” – Kallala Giri, OConstruction
Remember to adjust for external factors before drawing conclusions. For instance, a crew working in bad weather or on a complex custom design will naturally have lower productivity rates than one working in ideal conditions. Similarly, delays caused by material shortages or equipment downtime often point to management inefficiencies. Rework hours should also be tracked separately; a shift that looks productive but generates significant rework is ultimately costing you money. By accounting for weather, complexity, and delays, you can focus on actionable improvements.
Shift Metrics Comparison Table
A table like the one below can help you compare planned versus actual performance more clearly.
| Metric | Formula | Target Benchmark | Current Average |
|---|---|---|---|
| Labor Productivity | Total Output ÷ Total Man-Hours | Project-specific (e.g., sq. ft./hr) | Calculated from Daily Logs |
| Shift Utilization Rate | (Actual Work Hours ÷ Total Shift Hours) × 100 | 85%–90% | Calculated from Time Cards |
| Schedule Adherence | (Actual Hours ÷ Planned Hours) × 100 | 100% (Lower indicates delay) | Calculated from Crew Schedule |
For residential projects in 2026, here are some benchmarks to keep in mind: drywall hanging should average 30–40 sq. ft. per man-hour, standard bricklaying should hit 500–600 bricks per day, and plumbing rough-ins should take 4–6 man-hours per fixture. If your productivity variance (Earned Hours ÷ Actual Labor Hours) dips below 1.0, that shift didn’t meet the plan. Considering labor accounts for 40% to 50% of total project costs, these comparisons are essential to keeping budgets on track.
This table simplifies the process of identifying gaps, helping you take immediate corrective actions where needed.
Best Practices for Shift Optimization
1. Aligning Shifts with Project Goals
Tying labor data to your project schedule helps pinpoint sluggish tasks before they disrupt your critical path. By using cost codes to break down projects into specific tasks – like framing or electrical work – you can see exactly how labor hours stack up against your budget.
To make the most of your resources, assign skilled workers to the most critical phases of the project. Keep an eye on your Schedule Performance Index (SPI) to ensure you’re on track. The formula is simple:
SPI = Earned Value ÷ Planned Value
This metric reveals whether progress is meeting expectations. Labor costs, which often make up 20% to 50% of total project expenses, are even more impactful now with construction input prices over 40% higher than they were in February 2020.
Tracking planned hours versus actual hours worked allows you to spot discrepancies early. Weekly production report reviews are key to catching bottlenecks before they derail your timeline. These adjustments ensure that every shift stays aligned with project goals and minimizes costly delays.
2. Encouraging Communication and Feedback
Kick off each shift with a quick 5–10 minute morning huddle.
Use this time to set priorities, address safety concerns, and confirm the availability of materials and equipment. At the end of the shift, field crews should log completed tasks, hours worked, and site conditions – complete with photos – in a digital daily log. This gives the office team real-time insights into progress.
Centralizing communication on one platform prevents important information from getting lost in scattered emails or texts. When offering feedback, focus on comparing completed work (like square footage installed) to labor hours, rather than just tracking clock-in and clock-out times.
Standardized templates for daily reporting make it easier to analyze productivity across shifts and crews. Sharing live project schedules with subcontractors also reduces inefficiencies, like unnecessary trips to the site, by keeping everyone updated on timeline changes.
3. Tracking Progress with Technology
Using tools like Contractor Foreman can streamline task management, scheduling, and financial oversight all in one place. For example, GPS-enabled time cards not only track work hours but also ensure crews are working at the right locations. Real-time dashboards and Kanban boards allow for swift action when delays arise.
Kanban boards, in particular, provide a visual way to monitor shift tasks, helping you quickly identify and address bottlenecks. Contractor Foreman’s centralized document management system gives teams instant access to crucial files like daily logs, RFIs in construction, and submittals. With construction professionals losing 35% of their time to nonproductive activities – like searching for information – this kind of centralization can save over 14 hours per week per person.
The platform also offers a financial command center with real-time cost databases and job costing tools, making it easier to adjust budgets as the project evolves. Since only half of construction projects finish on time, leveraging technology to track and refine shift productivity can be a game-changer. Plus, its mobile-first design ensures teams can update data directly from the site, enabling quick responses to unexpected issues.
Conclusion
Shift productivity metrics take the guesswork out of project management by clearly showing who is doing what and when. Considering that construction professionals lose about 35% of their time to nonproductive tasks, this adds up to more than 14 hours of lost work per person each week. Centralizing data with digital logs and scheduling tools can make the difference between hitting deadlines and falling behind.
The stakes are high: with construction profit margins hovering around 6% and only half of projects finishing on time, every hour counts. Real-time access to job costing data and labor productivity metrics allows you to identify and fix issues before they impact your bottom line.
Heather Soderquist, VP of Construction Innovation at Jacobsen, highlights this point:
“KPIs help us make sound and confident decisions that impact financial performance, project progress, etc. In addition, critical KPIs alert us when a potential problem or risk needs immediate and ongoing special attention.”
This underscores the importance of choosing the right management tool.
Contractor Foreman simplifies this process by combining task management, scheduling, and financial tracking into one easy-to-use platform – starting at just $49 per month. With features like GPS-enabled time cards, real-time dashboards, and a support team that responds in an average of 13 seconds, you can start making informed decisions right away. The platform boasts a 4.5/5 ease-of-use rating, with 95% of support chats receiving 5 stars.
Whether you’re measuring labor productivity per shift, tracking adherence to schedules, or comparing crew performance, success starts with small, consistent actions. Use mobile-friendly tools to capture real-time field data, standardize your reporting templates, and review metrics weekly to catch trends early. With a 30-day free trial and a 100-day money-back guarantee, there’s no reason to let inefficiencies linger. By prioritizing precise, real-time data, you’re setting your projects up for success.
FAQs
What’s the easiest way to choose the right unit of work for each shift?
The most straightforward approach is to establish measurable work units, such as completed project phases or installed quantities, and connect verified labor hours to these specific outputs. This method ensures that productivity stays on track with expectations and offers a clear framework for monitoring efficiency.
How do I separate unavoidable downtime from preventable idle time in utilization?
To tell the difference between unavoidable downtime and preventable idle time, it’s important to dig into the reasons behind each. Unavoidable downtime includes things like scheduled breaks or routine maintenance – situations that are planned and necessary. On the other hand, preventable idle time happens because of inefficiencies, such as poor planning, unexpected delays, or miscommunication.
Tracking key metrics can make this distinction clearer. For example, monitoring the crew idle-time ratio and schedule performance can reveal patterns and pinpoint problem areas. Regularly reviewing downtime logs and checking how resources are allocated also helps refine this analysis. With these insights, you can address inefficiencies and boost overall productivity.
Which metrics should I track first if I’m starting from scratch?
Monitoring shift productivity, crew hours, and task completion rates is a great starting point. These metrics give you a clear picture of how efficiently your team is working and help pinpoint where adjustments might be needed.