
There are some things we can’t predict—like our partner’s mood, traffic when you’re already late, or whether a forecasted “10% chance of rain” actually means rain.
But luckily, when it comes to construction, uncertainty doesn’t have to be inevitable.
Predictive analytics is transforming construction planning by using historical and real-time data to forecast outcomes like costs, delays, and risks. By analyzing data from past projects – such as labor hours, budgets, safety logs, and weather patterns – contractors can make informed decisions.
Key Takeaways:
- Cost Forecasting: Predict future expenses by analyzing historical cost trends and real-time data.
- Improved Scheduling: Identify potential delays by studying task timelines, crew productivity, and subcontractor performance.
- Safety Insights: Use incident reports and environmental data to predict and prevent accidents.
- Centralized Data: Tools like Contractor Foreman consolidate project data, making it easier to generate actionable insights.
To make this work, contractors need to digitize their workflows, keep their data clean, and use predictive tools to adjust as projects move forward. While it takes some time to set up, the result is a major improvement—better project outcomes, stronger client relationships, and far fewer unexpected issues.
Building the Foundation: Data-Driven Construction Planning
To make accurate predictions, a strong foundation of reliable data is essential. Let’s dive into how to gather, organize, and use this data effectively.
Key Historical Data Sources
When it comes to planning, key data sources include cost codes, daily logs, productivity rates, safety reports, material consumption records, labor timecards, weather data (measured in °F and inches), supply chain logs, and equipment metrics.
However, scattered records stored in spreadsheets, emails, or even paper forms can disrupt this process. Centralizing data on a digital platform is the solution. Start by identifying where your planning data is currently stored – whether that’s in estimating software, accounting systems, scheduling tools, RFIs, or change orders. Next, use a construction management platform to bring all these sources together. This platform should standardize the capture of cost codes, daily entries, and productivity metrics across projects. Once centralized, the focus shifts to turning raw data into actionable insights.
From Raw Data to Predictive Models
With your data cleaned and organized, advanced techniques like regression, classification, and time-series analyses can turn historical information into forecasts for costs, schedules, and risks. For instance, historical labor rates (e.g., $45–$65 per hour) and material prices can provide a baseline for predictions.
The first step in this process is data cleaning. This involves removing duplicates, filling in missing information from incomplete logs, and standardizing formats to align with U.S. conventions – such as mm/dd/yyyy dates, dollar amounts like $10,000.00, and imperial measurements. Feature engineering, such as calculating weekly averages for productivity rates, further refines inputs so the models can detect meaningful patterns.
Digitizing Data with Construction Software
To make these predictive models truly functional, a digital platform is a must. Tools like Contractor Foreman simplify the process by centralizing project data through mobile apps for iOS and Android. These platforms integrate with popular tools like QuickBooks and Zapier, enabling real-time, standardized data entries.
Superintendents can log labor hours by cost code, track equipment usage, document delays, record weather conditions, and even attach photos – all of which build a comprehensive historical dataset. For smaller U.S. firms, free training and support make it easier to adopt these practices, ensuring that data collection is complete and accurate. This accuracy is the backbone of reliable predictive models.
How Predictive Analytics Improves Construction Planning
Predictive analytics is transforming construction planning by replacing guesswork with data-driven insights. From budgeting to scheduling and safety, it brings precision and foresight to every stage of the process.
Smarter Cost and Cash Flow Predictions
Predictive analytics taps into historical cost data, productivity stats, and real-time pricing to refine budget forecasts. By analyzing previous projects – factoring in trade, building type, region, and even seasons – it can predict labor hours, material needs, and unit costs with greater accuracy. This means estimators can set specific contingencies instead of applying generic markups.
For instance, mid-rise commercial projects in Texas often experience 8–12% cost overruns in HVAC and concrete, prompting predictive models to adjust bids accordingly. By feeding in data like billing trends, change orders, and payment delays, these tools also help contractors anticipate monthly cash flows – including retainage and late payments from certain owners. For example, if a public owner is known to pay bills 20–25 days late, the model can flag potential cash flow issues in advance. This gives finance teams time to adjust funding, reallocate crews, or renegotiate project milestones.
Tools like Contractor Foreman centralize job costs, billing, and change orders, providing the clean data needed for accurate cash flow models. These insights don’t just improve cost clarity – they also inform better scheduling and resource allocation.
More Accurate Scheduling and Resource Allocation
With refined cost projections, scheduling becomes even more precise. Predictive analytics uses data like task timelines, crew sizes, subcontractor performance, weather patterns, and material delivery logs to identify potential delays. For example, if drywall installation on healthcare projects often gets delayed due to MEP issues, planners can adjust the sequence or add buffers to avoid bottlenecks.
By analyzing timecards, crew productivity, and equipment usage, predictive models can also forecast staffing and equipment needs. For example, analytics might reveal how many carpenter-hours are typically required per 1,000 square feet for different building types. This allows contractors to anticipate labor shortages or overstaffing well in advance. Similarly, equipment telematics and rental data can predict peak demand for machinery like cranes or earthmovers, helping to optimize rental schedules and fleet usage. A general contractor could use these insights to avoid paying for idle boom lifts on overlapping projects while ensuring crews stay on schedule without unnecessary overtime.
Anticipating Risks and Enhancing Safety
Predictive analytics also plays a key role in safety management. By analyzing incident reports, near-miss logs, and environmental factors, it can identify patterns that link accidents to specific trades, tasks, or site zones. For example, falls are more frequent during winter steel erection on high-rise projects, while struck-by incidents tend to occur near loading zones during concrete placements.
These insights allow safety teams to assign risk scores to upcoming tasks, flagging high-risk areas or activities that need extra precautions. Instead of relying on generic safety rules, teams can focus on specific risks – like scheduling additional inspections, adjusting work sequences, or implementing task-specific training. Predictive dashboards turn these insights into actionable plans, such as increasing toolbox talks for high-risk tasks or rescheduling crane operations on windy days. If recurring data shows frequent hand injuries during concrete forming, targeted training and PPE checks can be prioritized for those crews.
How to Implement Predictive Analytics
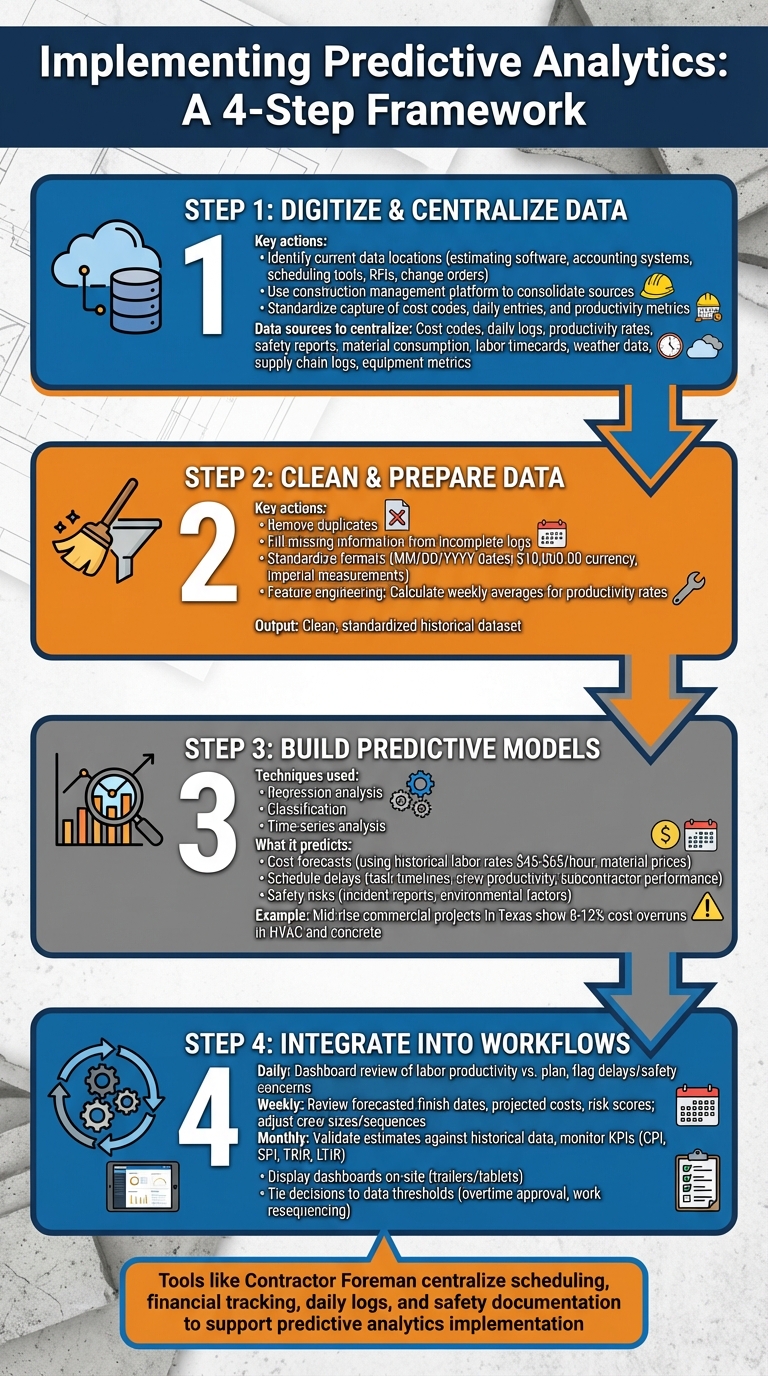
How to Implement Predictive Analytics in Construction: 4-Step Process
Turning predictive analytics from an abstract concept into a practical tool requires a shift in how your team handles data and integrates it into everyday operations. The aim is to make data-driven insights a natural part of decision-making rather than an afterthought.
Redesigning Planning Workflows
Start by mapping your project process, from initial bid to closeout, identifying where data is already being collected. Add checkpoints for analytics throughout the workflow – like validating estimates against historical data, coding baseline schedules, and using biweekly dashboards to monitor costs, schedules, and labor performance. Replace guesswork with data-driven estimates and digitally document all changes to plans.
Many U.S. companies begin by testing this approach on a single project or within one division before expanding it across the organization. For example, daily meetings can include a dashboard review showing the previous day’s labor productivity compared to the plan, flagging any delays or safety concerns. Weekly planning sessions might focus on forecasted finish dates, projected costs, and risk scores for key tasks based on historical trends, while also adjusting crew sizes or work sequences as needed. Displaying these dashboards on-site – whether in trailers or on tablets – and tying critical decisions like overtime approval or work resequencing to specific data thresholds helps reinforce the importance of predictive insights. However, these changes rely on a solid data management strategy to ensure the insights are accurate and actionable.
Data Strategy and Governance
A strong data strategy begins with clear business questions, such as “Which project types most frequently exceed labor budgets?” From there, identify the necessary data – like timecards, change orders, RFIs, weather conditions, and safety records – and determine where it will be stored. Governance is key: assign roles such as an executive sponsor to set priorities, data owners for specific areas (like project controls or safety) to maintain data quality, and project-level data stewards (often project engineers) to enforce standards daily. Standardized data management forms the backbone of reliable predictive models, supporting consistent planning across construction projects.
Establishing standard naming conventions and mandatory data fields during job setup is critical. For example, set rules requiring daily logs to be completed by 6:00 p.m. and timecards submitted by the end of each shift. Regular audits can catch errors or missing entries. Many firms formalize these practices in a “data playbook”, outlining expectations for formats like U.S. dates (MM/DD/YYYY), currency ($1,250,000.00), and units (feet, inches, pounds, °F) to maintain consistency across projects. Using a single cost code structure across the company, supported by a reference guide, focused training, and controlled code creation, further strengthens data reliability. With these governance practices in place, platforms like Contractor Foreman can help ensure data consistency and improve the accuracy of predictive analytics.
Predictive Data by Contractor Foreman
Contractor Foreman provides tools to standardize project templates, ensuring every job begins with consistent cost codes, custom fields, and workflows. By requiring mandatory cost codes and activities in timecards, every labor hour gets tied to a specific task, enabling predictive models to calculate accurate production rates for each trade. Key metrics – such as labor, weather, and financial data – can be logged within the platform to feed predictive models.
Safety modules in Contractor Foreman allow users to standardize data for inspections, incident reports, and toolbox talks by categorizing incident types, locations, causes, and severity levels. This makes it easier to analyze trends across projects, using both leading and lagging safety indicators. Similarly, ensuring RFIs, change orders, and submittals include consistent status options and dates enables better modeling of cycle times, helping teams anticipate how design decisions may impact schedules and costs.
Additionally, by consistently recording financial transactions – such as contract signings, purchase orders, and invoice payments – Contractor Foreman enables contractors to calculate typical lead times and payment cycles for various trades and suppliers. Over time, this data allows for more precise predictions, not only of “How much will this cost?” but also “When will we need cash on hand?” for each phase of work, all in U.S. dollars. This level of detail helps contractors plan more effectively and manage resources with greater confidence.
sbb-itb-5eea312
Measuring the Impact of Predictive Analytics
Key Metrics and Dashboards
To gauge project performance effectively, certain key performance indicators (KPIs) are essential. Two critical metrics are CPI (Cost Performance Index), calculated as Earned Value divided by Actual Cost, and SPI (Schedule Performance Index), which is Earned Value divided by Planned Value. A value above 1.0 for either metric signals favorable performance. Safety metrics like TRIR (Total Recordable Incident Rate) and LTIR (Lost Time Incident Rate) are also tracked, normalized per 200,000 hours worked, offering a standardized view of safety performance.
Dashboards play a central role in visualizing and integrating this data. These tools combine forecast curves, weekly trends, predicted completion dates, and risk heatmaps to provide a clear snapshot of both current progress and future projections. For executives, dashboards often roll up into portfolio-level insights, such as the percentage of projects expected to finish within ±5% of budget, forecasted profit margins by client or region, and safety indicators that predict high-risk days based on factors like weather or task conditions.
Continuous Improvement Through Feedback Loops
A robust feedback loop is critical to refining predictive models over time. By systematically reviewing completed project data, teams can improve the accuracy of future forecasts. After each project, final cost breakdowns, schedule variances, crew productivity, and safety outcomes are compared against earlier predictions from the bidding, planning, and execution phases. These comparisons highlight discrepancies, which are then used to recalibrate model parameters – adjusting risk factors, productivity benchmarks, and weather-related assumptions. Lessons learned are categorized by specific project attributes, such as building type, region, or contract form, ensuring future estimates are more tailored and precise.
For ongoing projects, predictive analytics becomes a regular agenda item during weekly coordination meetings. Teams analyze metrics like forecasted CPI/SPI, expected completion dates, and potential risks. Based on these insights, they make adjustments such as resequencing tasks, modifying crew sizes, or addressing underperformance. Field supervisors rely on productivity forecasts and risk scores to plan daily tasks, while safety teams focus their efforts on high-risk days, organizing toolbox talks or inspections accordingly. By documenting these actions and evaluating their outcomes, teams continuously refine both their operational strategies and the predictive models themselves. This cycle of review and adjustment drives long-term improvements.
Long-Term Business Benefits
Large construction projects often face significant challenges, with McKinsey reporting that they typically run 20% longer than planned and exceed budgets by as much as 80%. Predictive analytics offers a way to combat these issues. Over time, data-driven insights lead to more accurate planning, fewer delays, and reduced cost overruns. Contractors who leverage these tools see steadier margins and an increased likelihood of completing projects on or ahead of schedule. Safety outcomes also improve, as high-risk scenarios are identified and mitigated before incidents occur.
By basing decisions on data rather than intuition, contractors can build stronger relationships with clients. During preconstruction, they can present evidence-based cost and schedule estimates grounded in historical performance. Throughout the project, sharing dashboards that compare forecasts with actual progress and highlight potential risks reassures clients that challenges are being proactively managed. When projects consistently meet their original forecasts, with fewer safety incidents and change orders, contractors earn a reputation as reliable, low-risk partners. This trust translates into repeat business and more favorable contract negotiations.
Platforms like Contractor Foreman streamline this process by centralizing tools for project management, financial tracking, scheduling, daily logs, and safety documentation. This integration helps contractors monitor and measure the metrics that matter most, ensuring they stay on top of their project portfolios.
Conclusion
Predictive analytics is reshaping construction planning by turning guesswork into data-driven decision-making. By analyzing historical data – like costs, schedules, productivity, and safety – contractors can forecast expenses, allocate resources more effectively, and anticipate potential risks. This means better bidding, smoother project execution, and fewer unexpected setbacks.
To get started, focus on digitizing project data, establishing clear data management practices, and embedding predictive tools into your planning processes. Tools like Contractor Foreman simplify this by centralizing scheduling, financial tracking, daily logs, and project documentation. With a strong data foundation, contractors can simulate scenarios during preconstruction, adapt plans in real time, and refine their models based on lessons learned from completed projects. This approach leads to more efficient project management and stronger risk mitigation.
The benefits go beyond individual projects. Research published in Automation in Construction highlights how predictive analytics helps forecast disruptions early, improving risk management. Contractors also report fewer budget overruns and improved safety outcomes. Delivering projects on time and within budget not only enhances client trust but also establishes contractors as dependable, low-risk partners – leading to stronger relationships and repeat business.
FAQs
How can predictive analytics enhance safety on construction sites?
Predictive analytics is making construction sites safer by digging into historical data to spot patterns that could signal potential risks. With this insight, project teams can tackle hazards before they escalate, helping to minimize accidents and injuries.
For example, by predicting issues like equipment malfunctions, weather-related challenges, or areas with higher safety concerns, construction managers can take specific actions to address these risks. This might include implementing focused safety protocols or strategically deploying resources. The result? A safer work environment for everyone involved.
What types of data are essential for using predictive analytics in construction planning?
To get the best results from predictive analytics in construction, start with historical project data – this includes information on timelines, budgets, and project outcomes. You’ll also need data on site conditions, weather patterns, resource availability, financial records, and equipment usage logs. Analyzing these factors helps identify trends, foresee potential issues, and improve project planning.
What steps can contractors take to start using predictive analytics in their construction projects?
To dive into predictive analytics, start by collecting historical project data – this includes details like costs, schedules, and resource usage. Carefully analyze this information to uncover patterns and trends that can guide future decisions. Use these insights to build predictive models and weave them into your project management processes.
Keep refining your models by incorporating real-time data to boost their accuracy over time. Leveraging tools such as advanced construction management software can simplify data collection and analysis, making it much easier to implement predictive analytics in your projects.
Related Blog Posts
- How to Create Accurate Construction Financial Projections
- How Workforce Data Improves Construction Outcomes
- How Predictive Analytics Enhances Construction Planning